XRP Taps $0.5 Critical Support But Will Bulls Finally Take Control? (Ripple Price Analysis)
Ripple’s price has been consolidating for the past few months, showing no decisive move in either direction. The price has been unable to break out of the current range, leaving many investors wondering what could happen next.
Technical Analysis
By: Edris
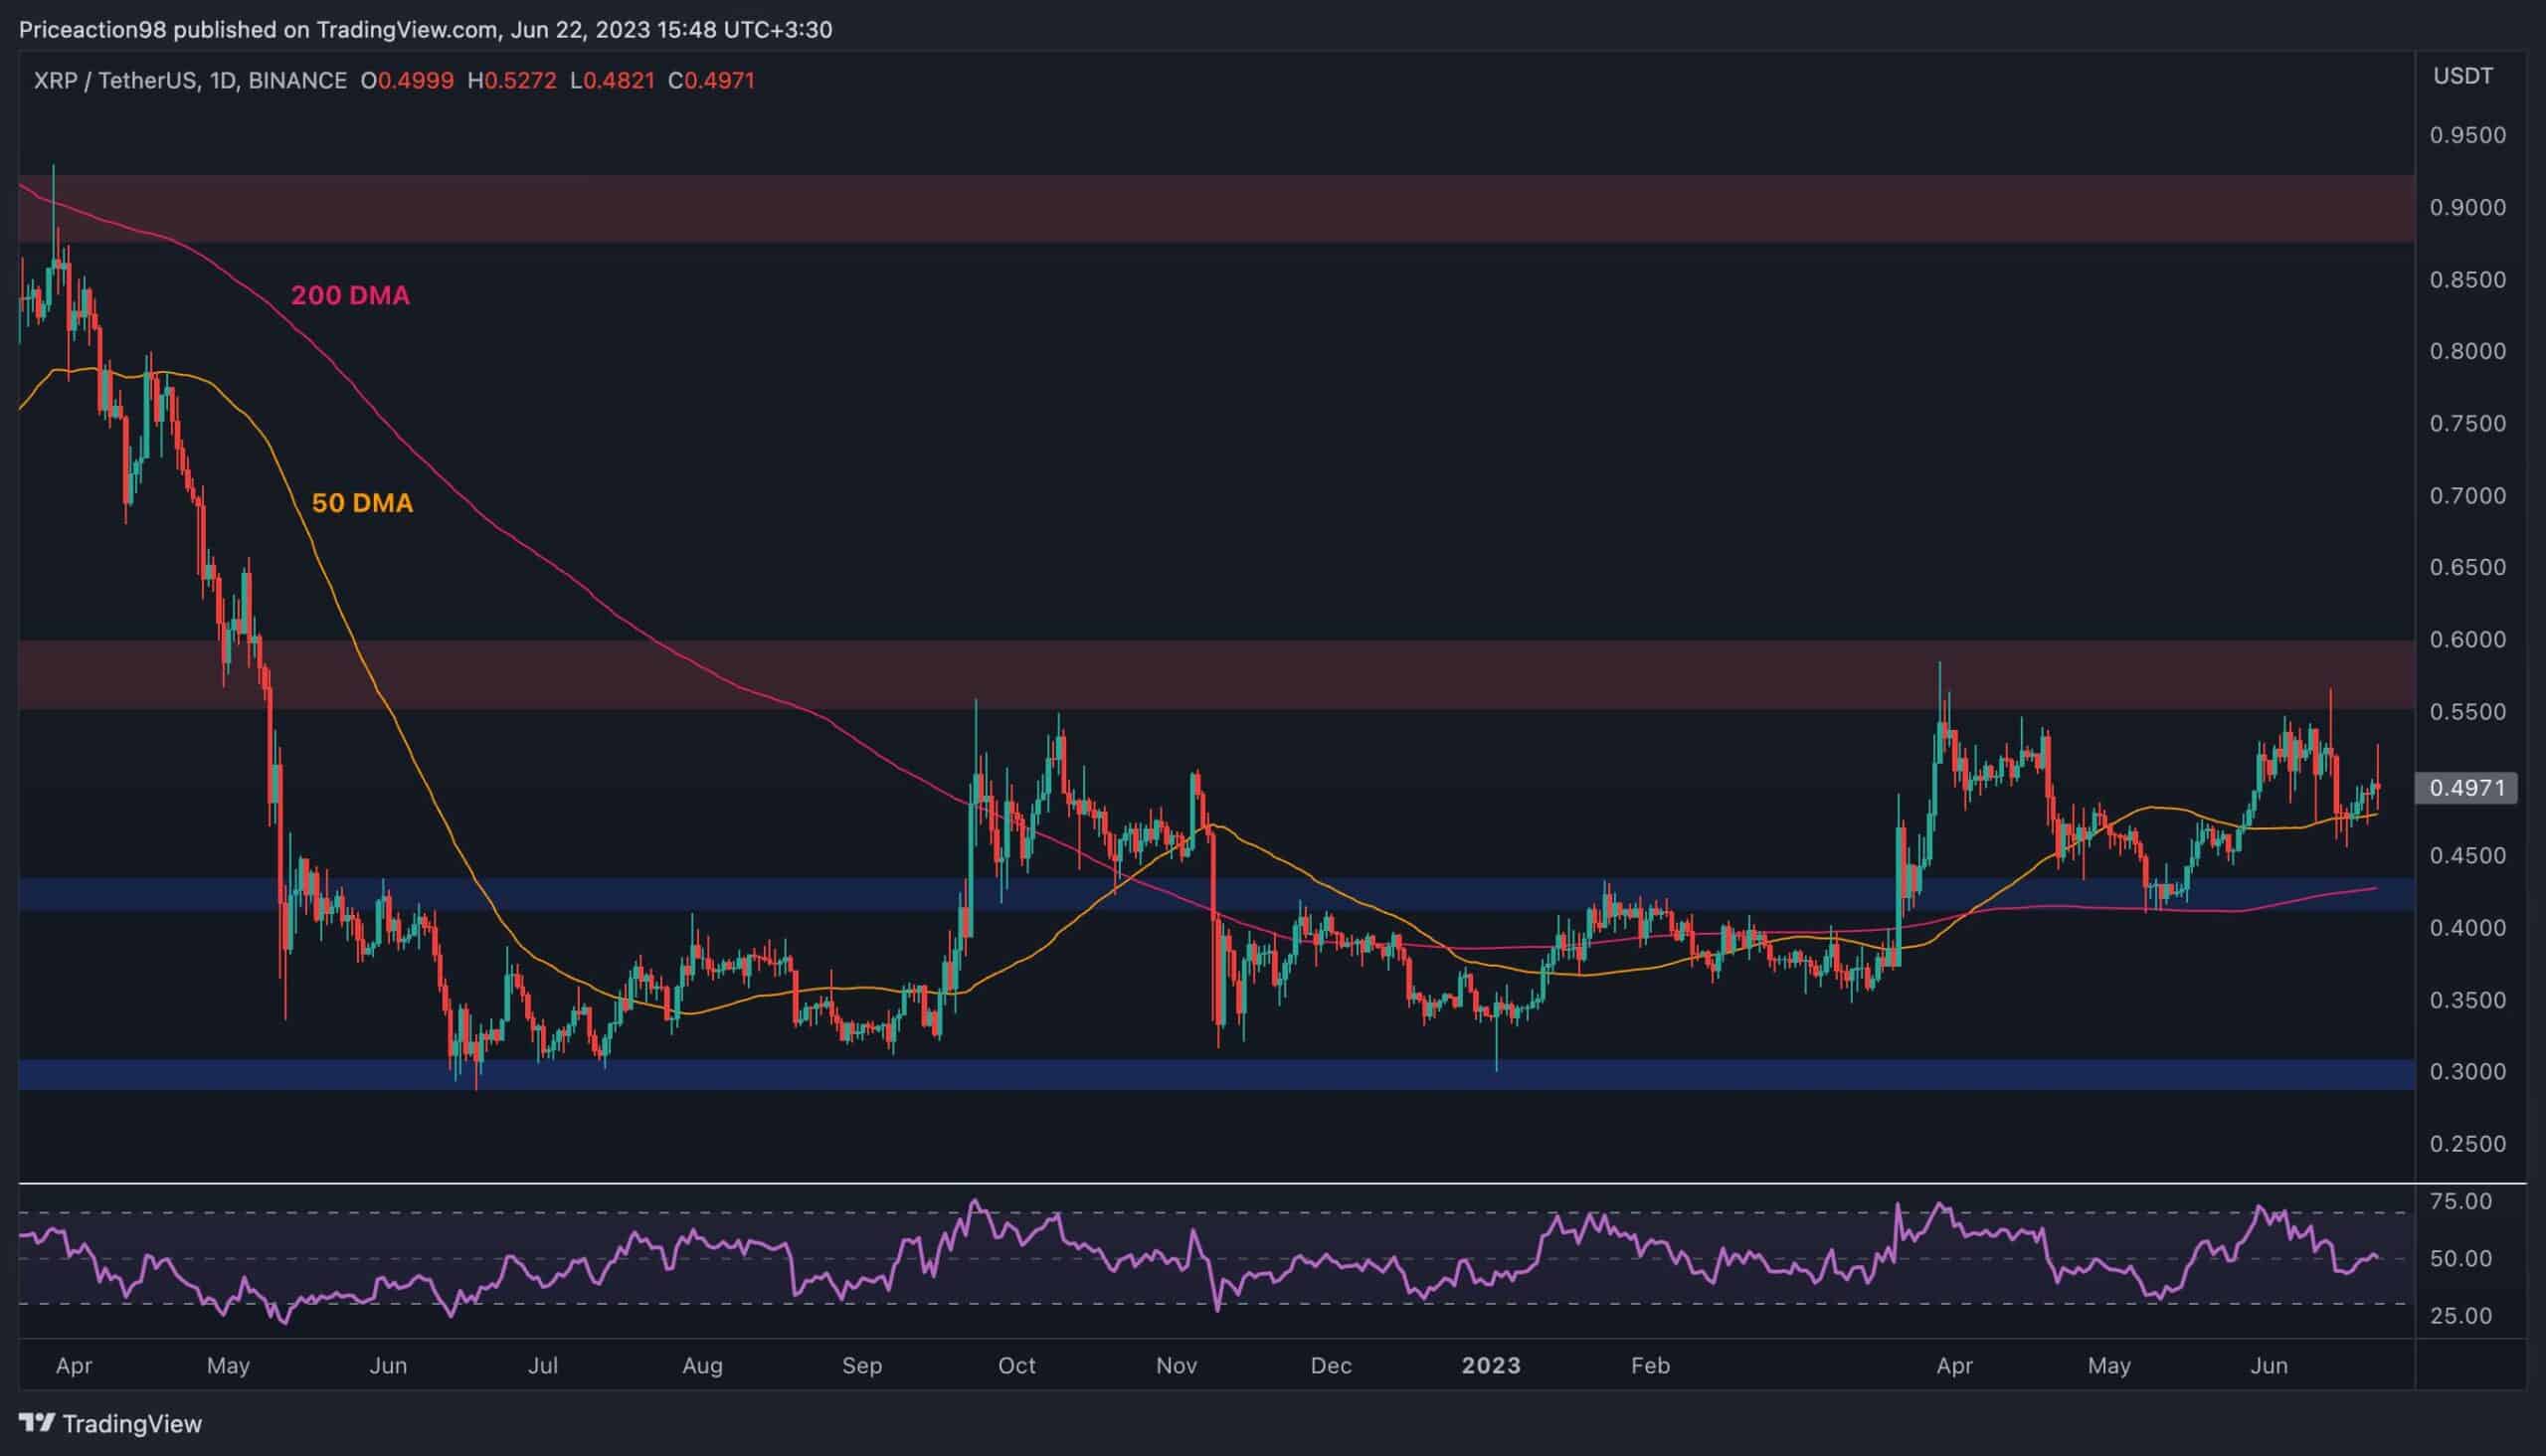
XRP/USDT Daily Chart:
XRP has faced rejection from the $0.6 resistance area, resulting in a pullback. The price currently finds support at the 50-day moving average, around $0.49. If it continues to decline, the next support level to watch is the 200-day moving average, located near the $0.43 mark.
The price must hold above these support levels, as a break below them would have significant negative implications. In such a scenario, the cryptocurrency could potentially plummet even lower.

XRP/BTC Daily Chart
Against Bitcoin, XRP has experienced a significant reversal below the 2200 SAT resistance level. This decline has been accompanied by breaks below the 200-day and 50-day moving averages, which occurred around the 1800 SAT level.
The next immediate target for the price appears to be a short-term retest of the 1500 SAT level.
The RSI indicator has been rapidly declining and nearing the oversold area, suggesting the possibility of consolidation or a potential pause in the selling pressure in the coming days. However, it is essential to closely monitor the price action and further developments, as the overall outlook for XRP remains bearish on the BTC paired chart.

The post XRP Taps $0.5 Critical Support But Will Bulls Finally Take Control? (Ripple Price Analysis) appeared first on CryptoPotato.


