XRP Surges 16% in Five Days, Here’s the Next Target (Ripple Price Analysis)
In the last five days, Ripple has grown by an impressive 16%, reaching highs exceeding $0.36 in today’s market. However, this doesn’t mean that the bearish trend has come to a halt.
Technical Analysis
By Grizzly
The Daily Chart
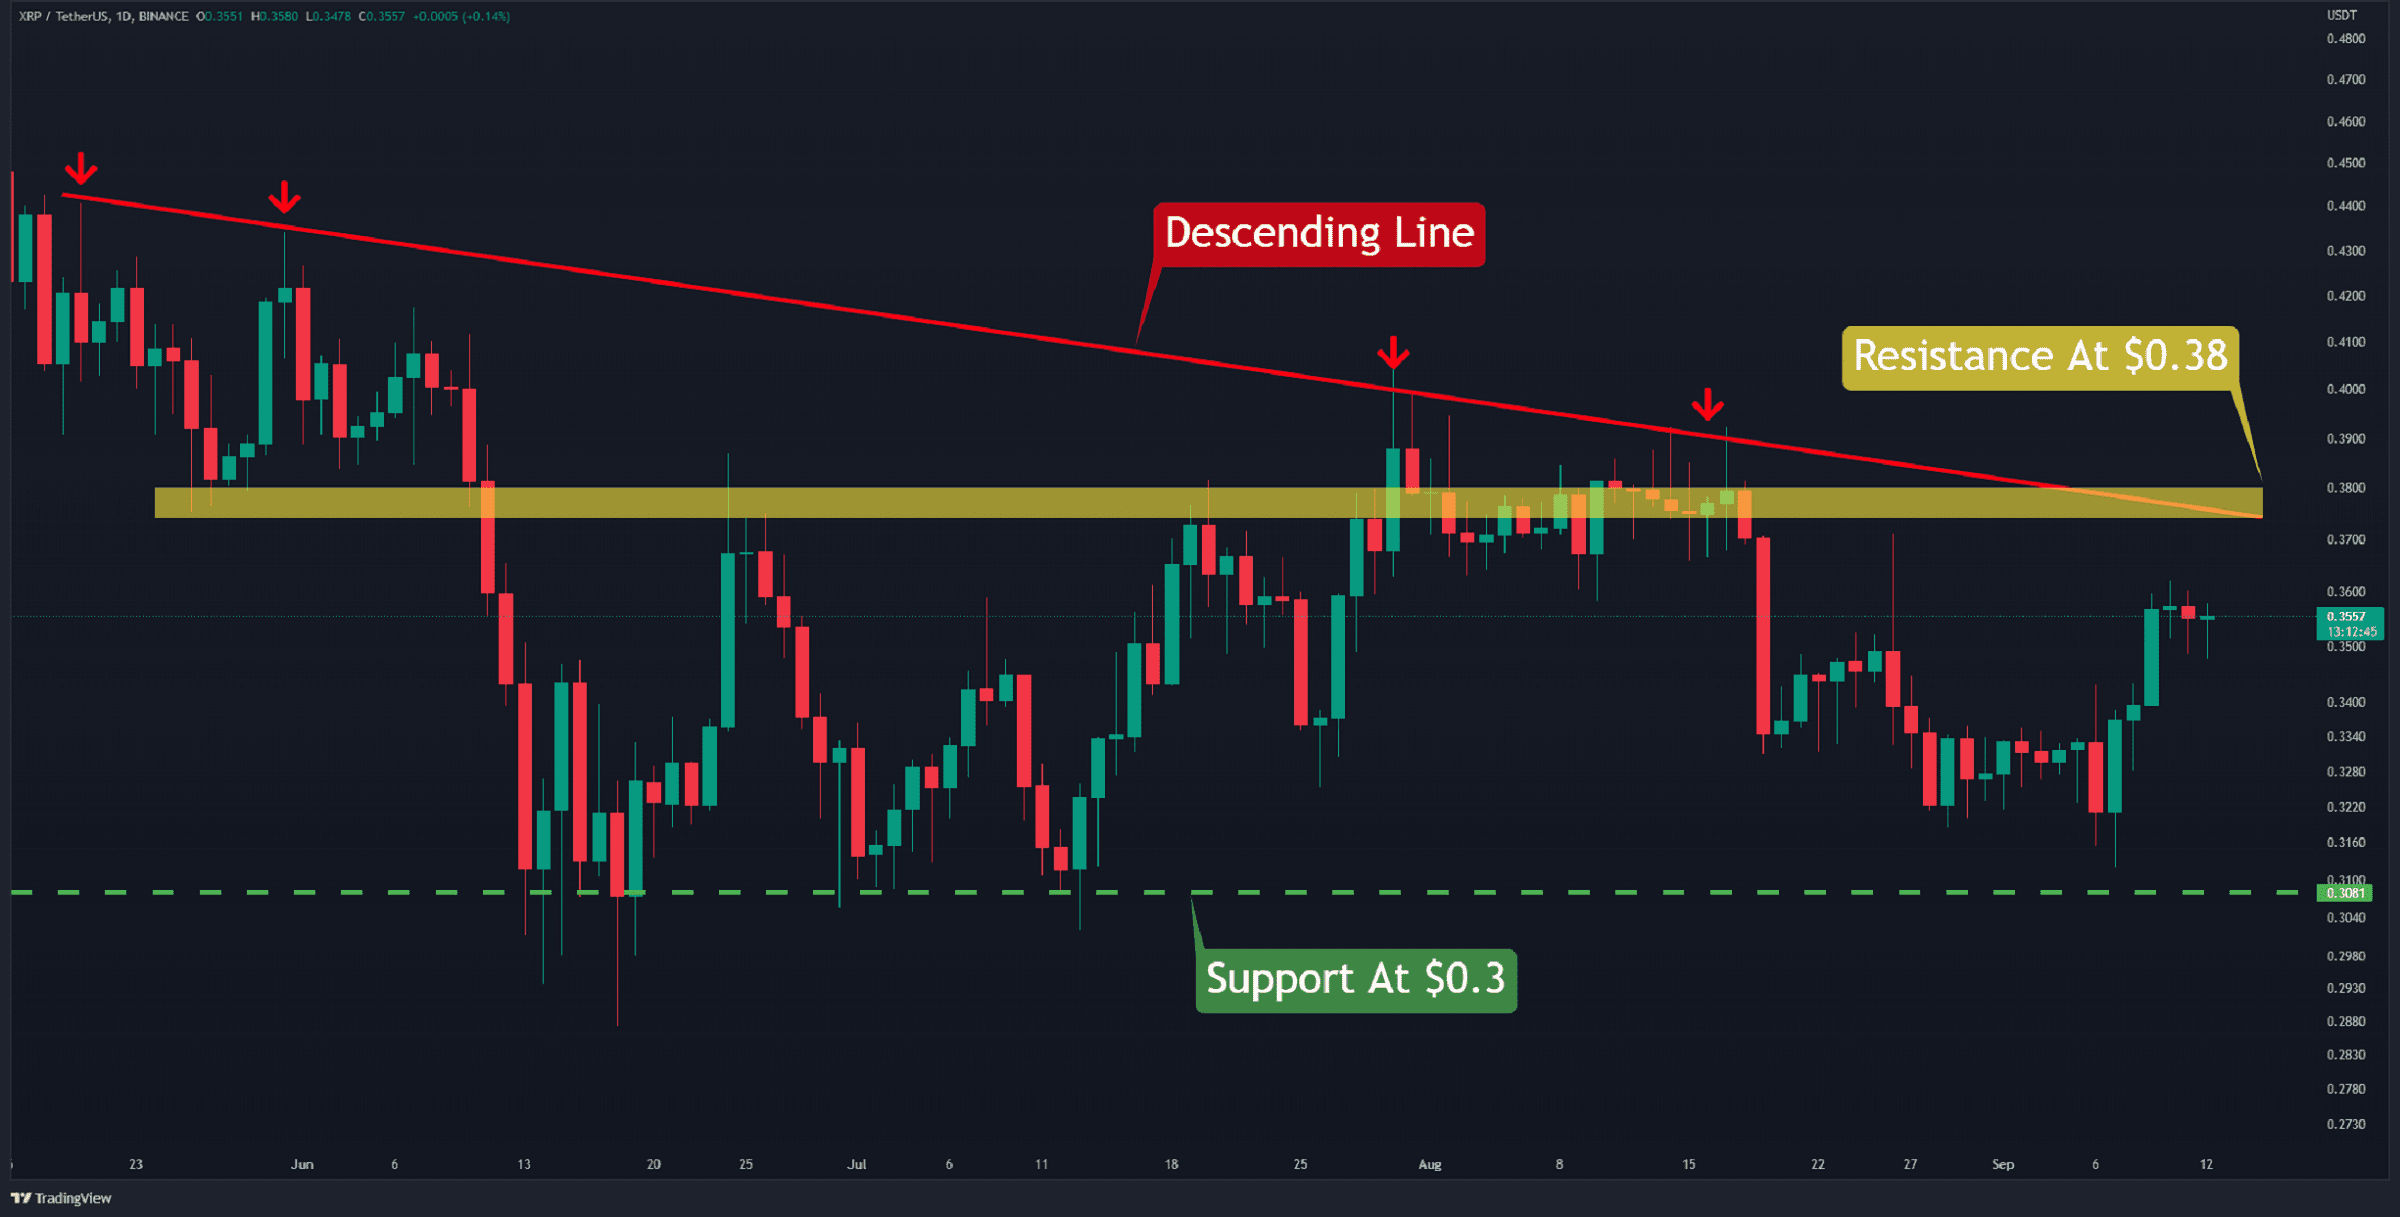
Once again, the bulls have demonstrated their determination to prevent the price from falling below $0.3 (in green). The next resistance for the cryptocurrency lies at $0.38 (in yellow). XRP has gone through a sideways trend as buyers were unable to breach the resistance of the descending line (in red) since June 22. This also means that the pair has formed lower highs sine then.
Currently, the horizontal resistance at $0.38 overlaps with the red resistance. A close and break above this zone will further strengthen the current bullish sentiment. In that case, the 200-day moving average, currently at $0.51, might get tested.
Technically speaking, the current structure is still not bullish. Uptrends are temporary until the price breaks out of the consolidation zone. On the other hand, if this turns out to be a fakeout and the price breaks below $0.3, support can be found at $0.24.
Key Support Levels: $0.30 & $0.24
Key Resistance Levels: $0.38 & $0.43
Daily Moving Averages:
MA20: $0.33
MA50: $0.35
MA100: $0.35
MA200: $0.51
The XRP/BTC Chart
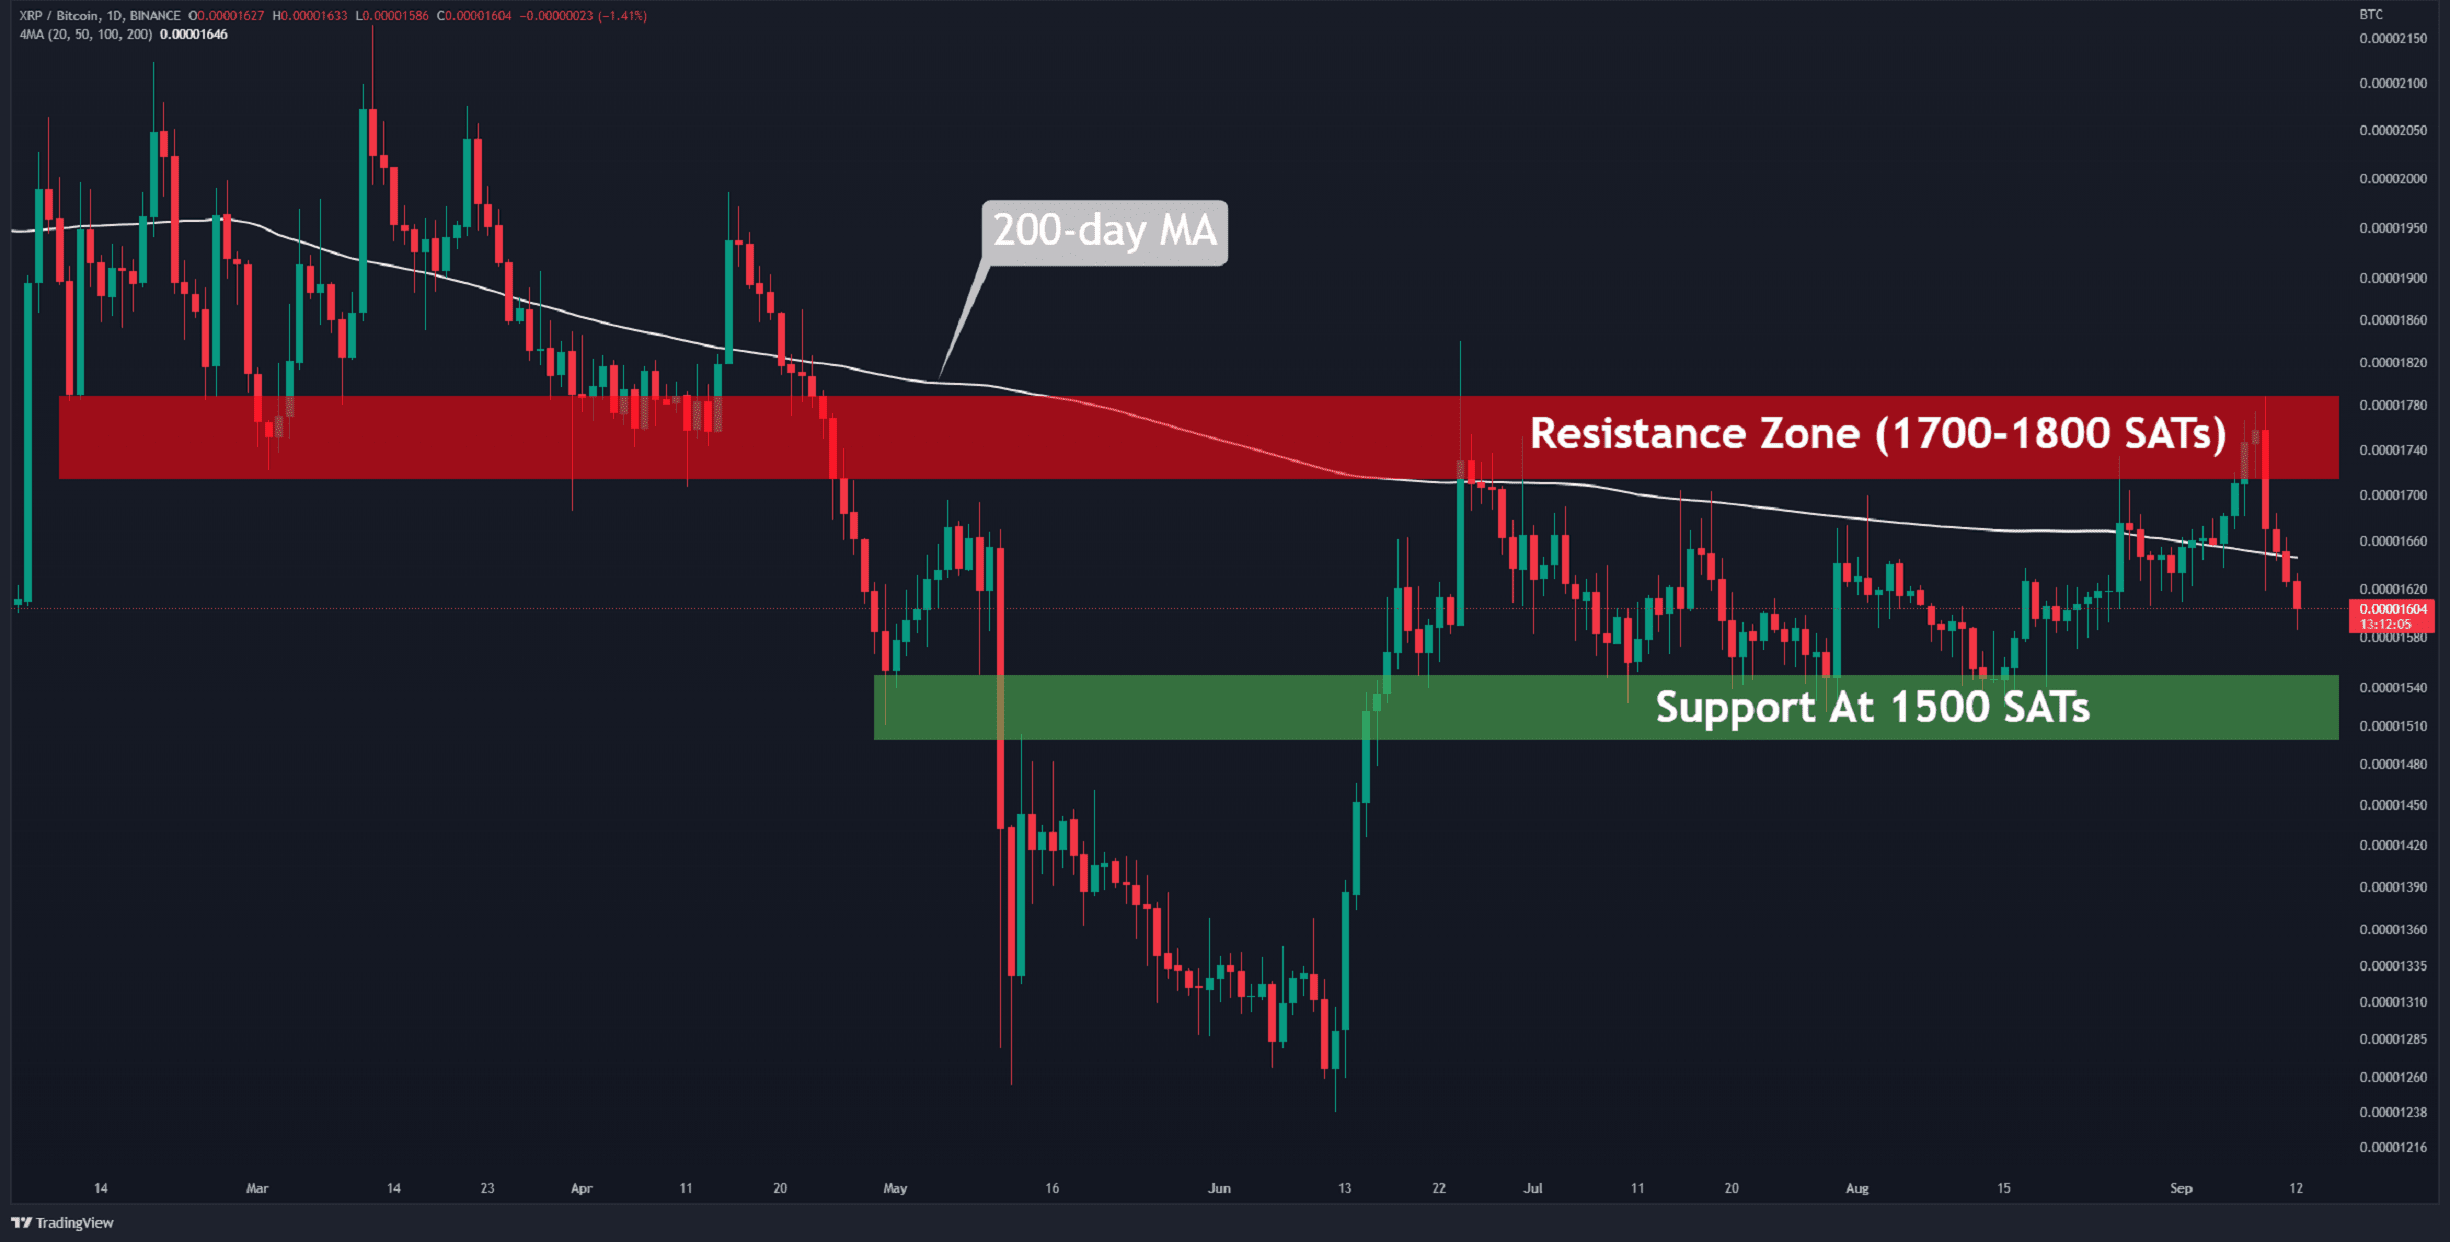
The green momentum against BTC, which began on August 14 and then continued for 25 days, was stopped after hitting the resistance area between 1700 and 1800 SATs (in red). The price breached the 200-day moving average (in white) after the bears drove the cryptocurrency down 11% in the last four days. Clearly, the bullish structure has shifted. A subsequent retest of horizontal support at 1500 SATs (in green) may come into play. It is possible that the pair will slip below the support area if Bitcoin keeps outperforming altcoins.
Key Support Levels: 1650 SATs & 1500 SATs
Key Resistance Levels: 1800 SATs & 2100 SATs
The post XRP Surges 16% in Five Days, Here’s the Next Target (Ripple Price Analysis) appeared first on CryptoPotato.

