XRP Surges 12% on the Back of Triangle Pattern, Rising Futures Bets Favor Bullish Price Moves Ahead
-
XRP surged 12% to extend weekly gains to over 40%, beating other major tokens.
-
A bullish triangle pattern on XRP’s long-term price charts and a substantial increase in open interest suggest more upside in the coming weeks.
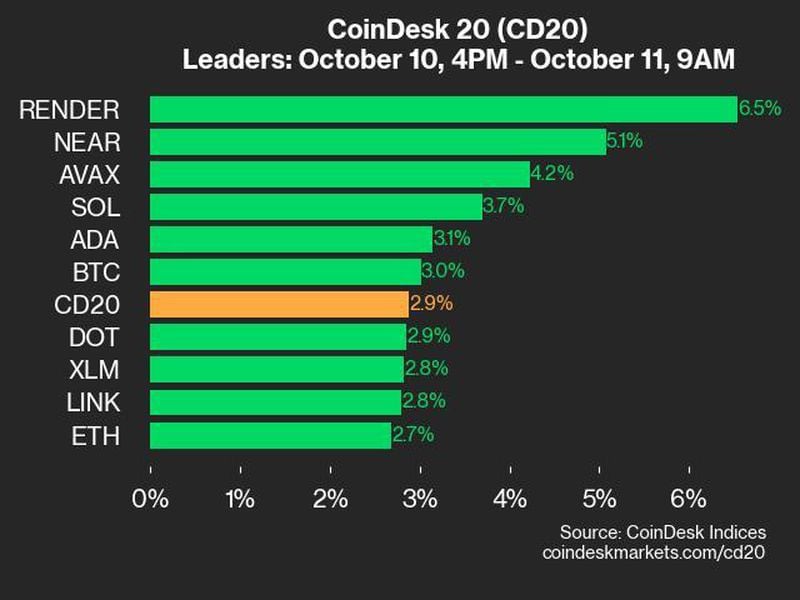
XRP surged 12% in the past 24 hours to lead gains among crypto majors, beating bitcoin (BTC) and the broader CoinDesk 20 (CD20) index.
The token added 5% since the start of Asian trading hours on Wednesday to extend seven-day gains to nearly 40%, making it the best-performing major despite favorable regulatory developments for ether (ETH) and demand for meme coins.
“XRP has been performing worse than the market for a long time, but the reversal of sentiment in crypto has sparked a rise on steroids in the once-largest altcoin. On the latest bounce, the price rose to 60 cents, its highest since April. This is an attempt to jump back into the uptrend of the past two years, ” Alex Kuptsikevich, FxPro senior market analyst said.
However, it may well turn out that XRP needs to rest after the climb. And this high is appropriate, as we saw prolonged consolidations here in November-December and March, Kuptsikevich added.
Gains in the token started last week as traditional futures powerhouses CME and CF Benchmarks announced the debut of indices and reference rates for XRP. And such moves have formed a triangle pattern on long-term price charts, which some popular traders say could favor bullish action in the coming weeks.
“I have never seen a 7-year-long bull pennant,” posted crypto trader @MichaelXBT on X. “We might be about to witness one of the most significant breakouts in crypto history.”
The triangle pattern is a popular technical analysis chart formation that helps traders understand market sentiment and spot emerging trends. It forms when an asset’s price trades in a narrow range following an uptrend or downtrend.
Chartists see a breakout from a triangular pattern, especially on heavy volumes, as bullish, which may favor upward price movements.
Meanwhile, open interest on futures tracking XRP has more than doubled in the past seven days, suggesting increased expectations of future price volatility. Open interest is the amount of unsettled futures trades.
CoinGlass data shows that XRP futures had racked up over $780 million in bets as of Wednesday, up from the $420 million on July 9, bringing it to levels last seen in mid-April. Trading volumes for the tokens have surged from $2 billion to $3.6 billion in the period, CoinGecko data shows.
:format(jpg)/cloudfront-us-east-1.images.arcpublishing.com/coindesk/UZEWLAOFRZH47FEIMV7FFS5H4A.png)
Over 60% of XRP futures bets opened in the past 24 hours are longs, or bets on higher prices, data from Coinalyze shows. Such a bump in open interest, alongside trading volumes, indicates new money entering the market and expecting XRP to rise higher.
Edited by Parikshit Mishra.


