XRP Recovers 10% in a Week, Will the Recovery Continue? (Ripple Price Analysis)
The crypto market has not yet recovered from the recent collapse. During this time, Ripple continues its macro downward trend from last year and is currently trading close to its lowest yearly level.
Technical Analysis
By Grizzly
The Daily Chart
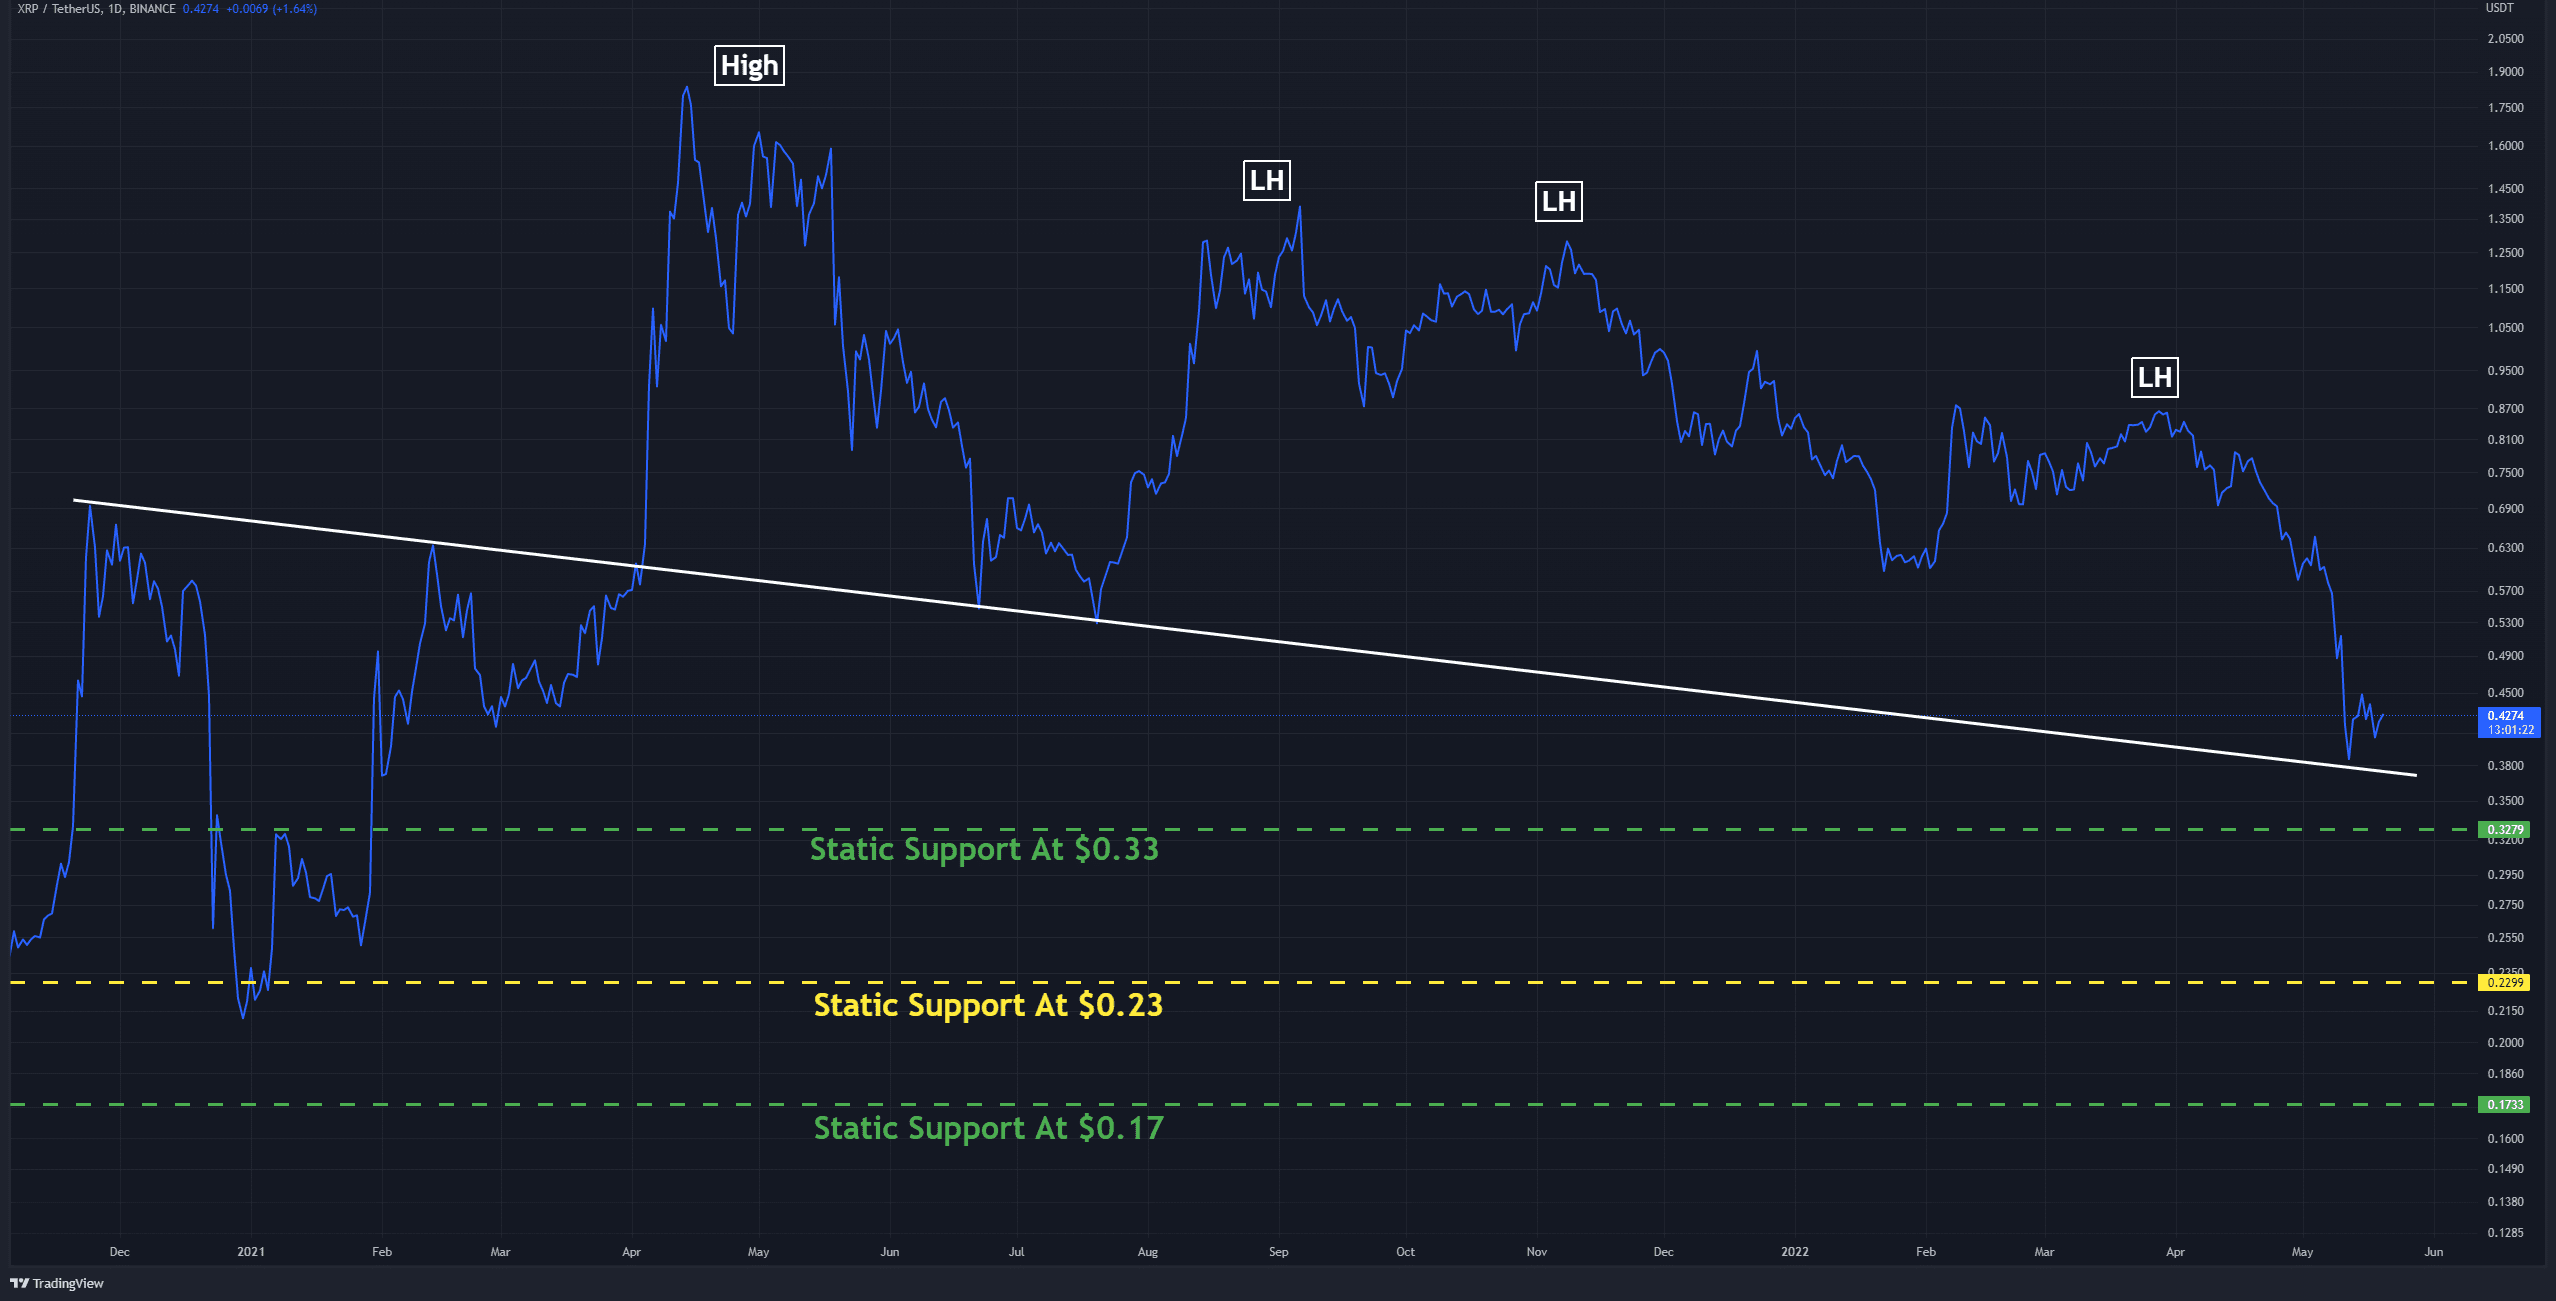
As seen in the daily timeframes and linear graph, XRP has reached the descending line (in white), which is now acting as support. Since hitting this level, the market bounced significantly. Suppose the bulls can hold the price above the static support level at $0.33 (in green) and accumulate strongly in this area. In that case, the cryptocurrency might attempt a shot at $0.51. To achieve this, Ripple must form a higher high than the last one, which it has not been able to do in the past year.
At this point, XRP requires a catalyst, such as fundamentally positive news. A possible drive could be a positive outcome of the SEC trial.
Key Support Levels: $0.33 & $0.17
Key Resistance Levels: $0.55 & $0.68
Moving Averages:
MA20: $0.50
MA50: $0.64
MA100: $0.71
MA200: $0.79
The 4-Hour Chart
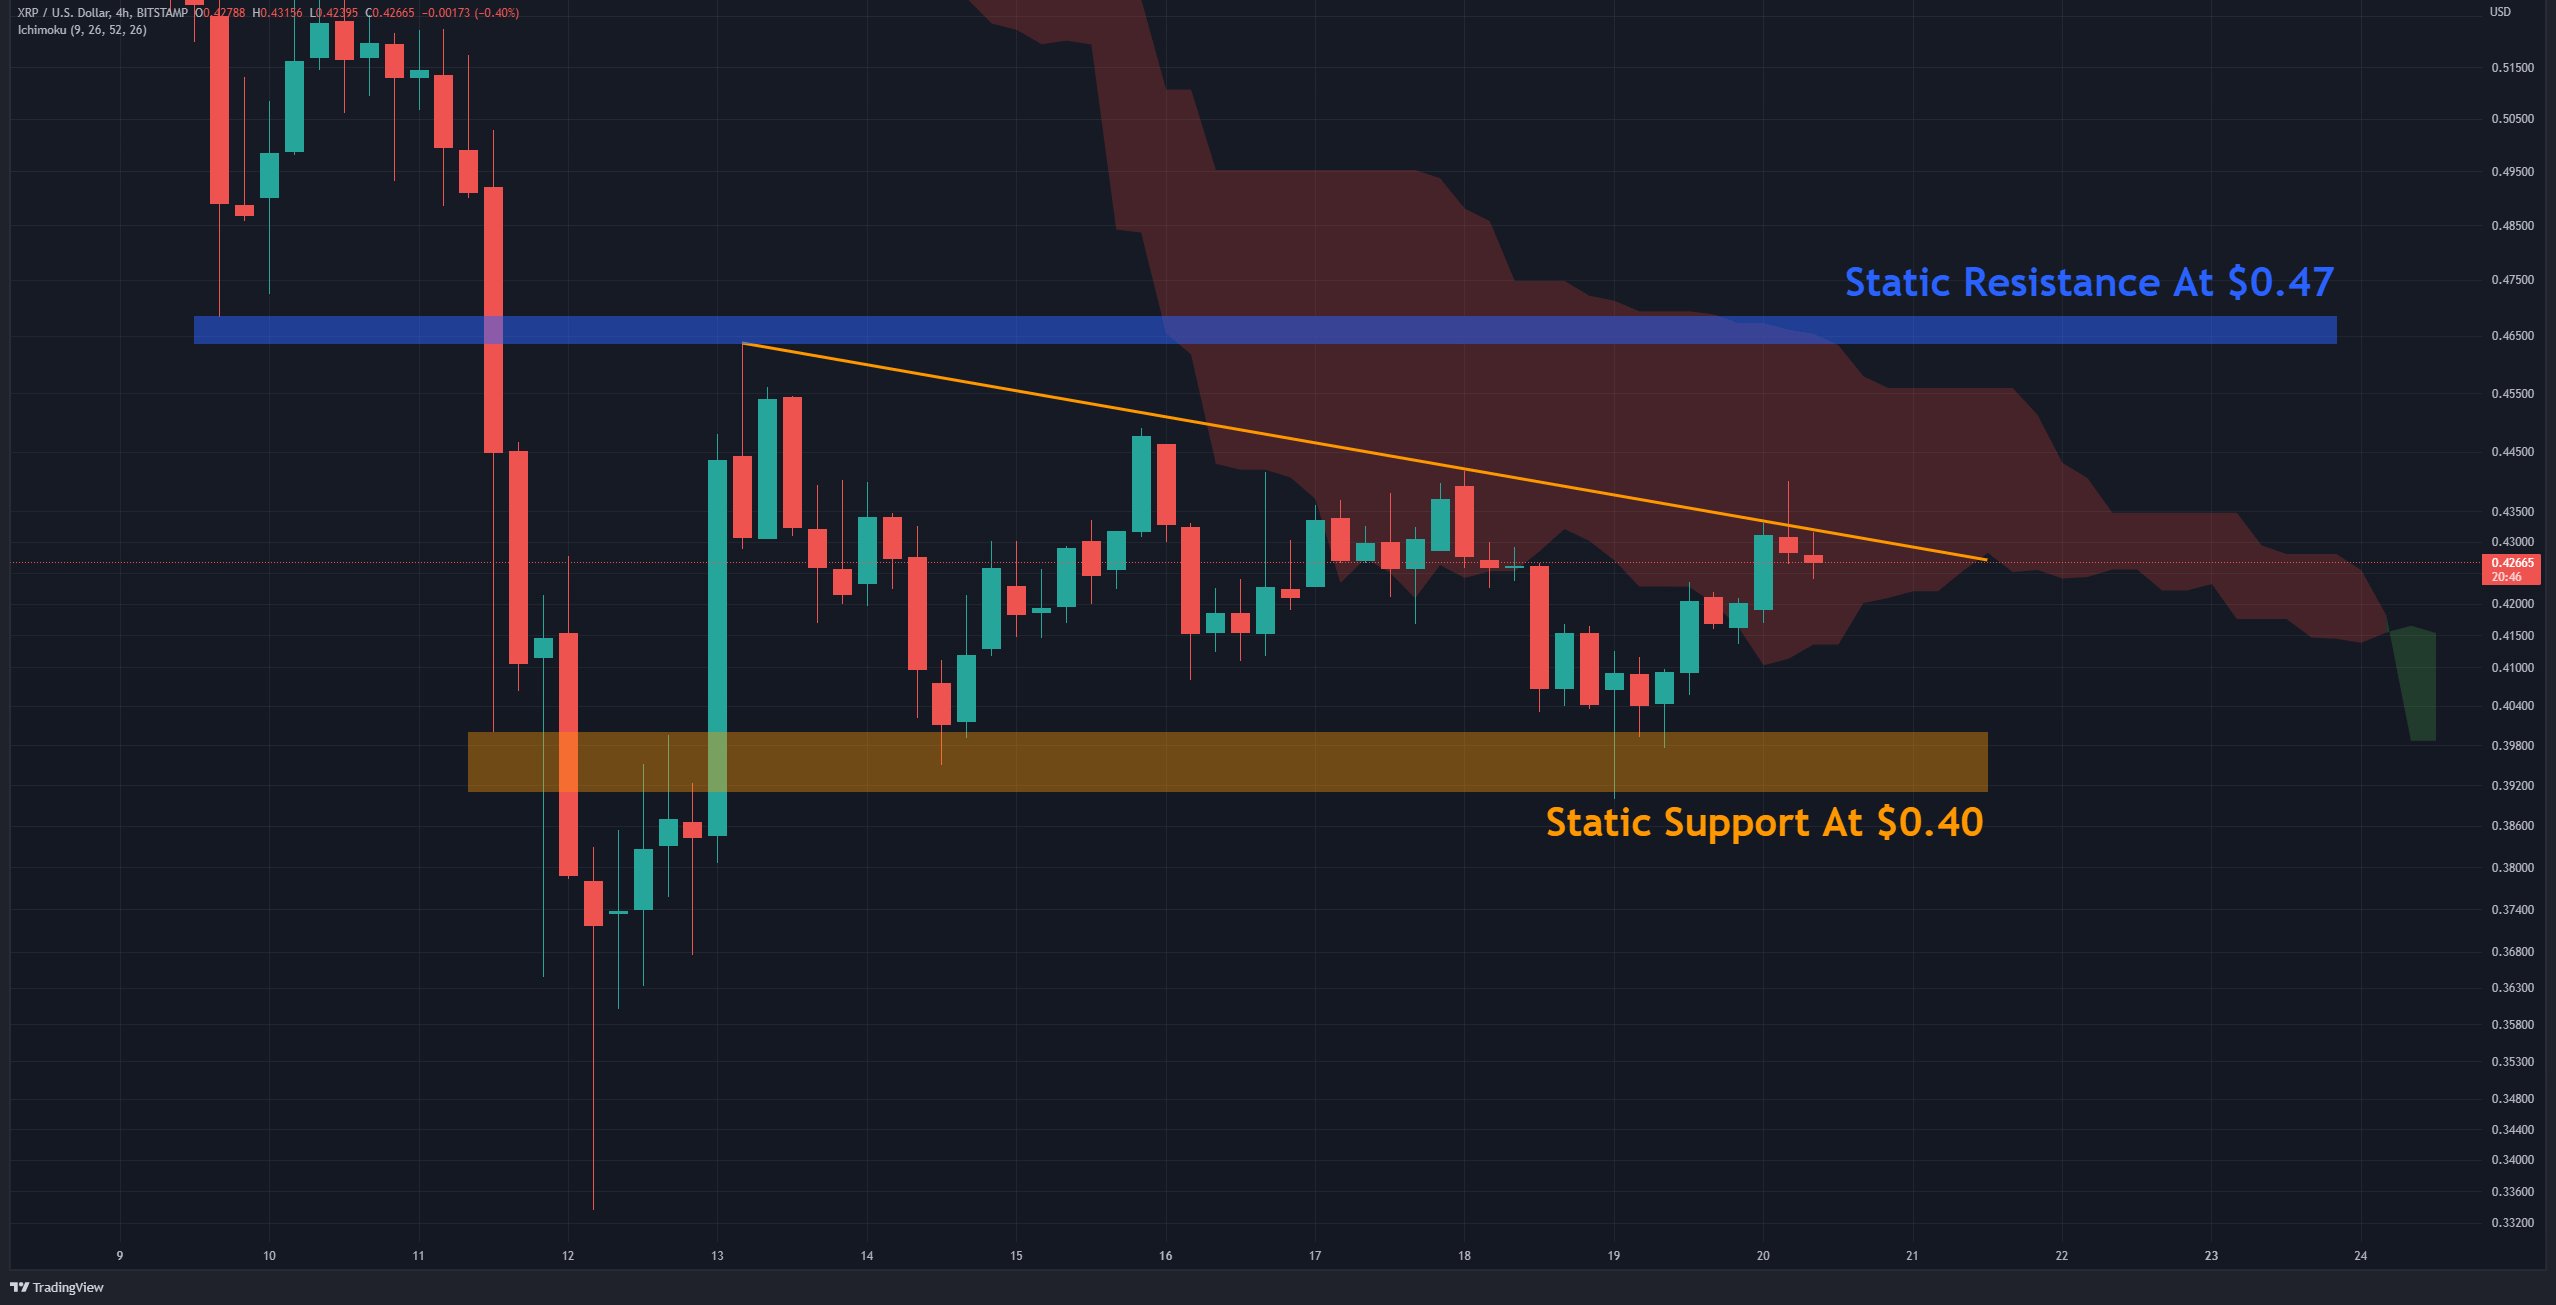
On the 4-hour timeframe, XRP fluctuates within a descending triangle (in orange). A pattern that is often considered bearish. However, there are two possible scenarios:
First: if the bulls can push the price above the horizontal resistance at $0.047 (in blue), then one can consider a short-term uptrend.
Second: if the horizontal support at $0.04 is breached, the bearish pattern will be confirmed, and once again, the demand area will likely be tested in the range of $0.33-$0.36.
The XRP/BTC chart
The BTC pair chart shows the price fluctuating between the Fibonacci levels of 0.618 and 0.5, which serve as support and resistance levels.
Given that horizontal support at 1550 Sats has now become a critical resistance, bulls should be able to return above it before initiating any robust moves. Suppose the support at 1250 Sats is lost. In that case, the horizontal support at 917 Sats, which is the Fibonacci level at 0.786, may prevent further declines.