XRP Pumps Above $0.6 but is a Correction Next? (Ripple Price Analysis)
Ripple’s price is continuing its bullish momentum while also experiencing a rebound against BTC. Things are beginning to look positive for XRP.
Technical Analysis
By TradingRage
The USDT Paired Chart
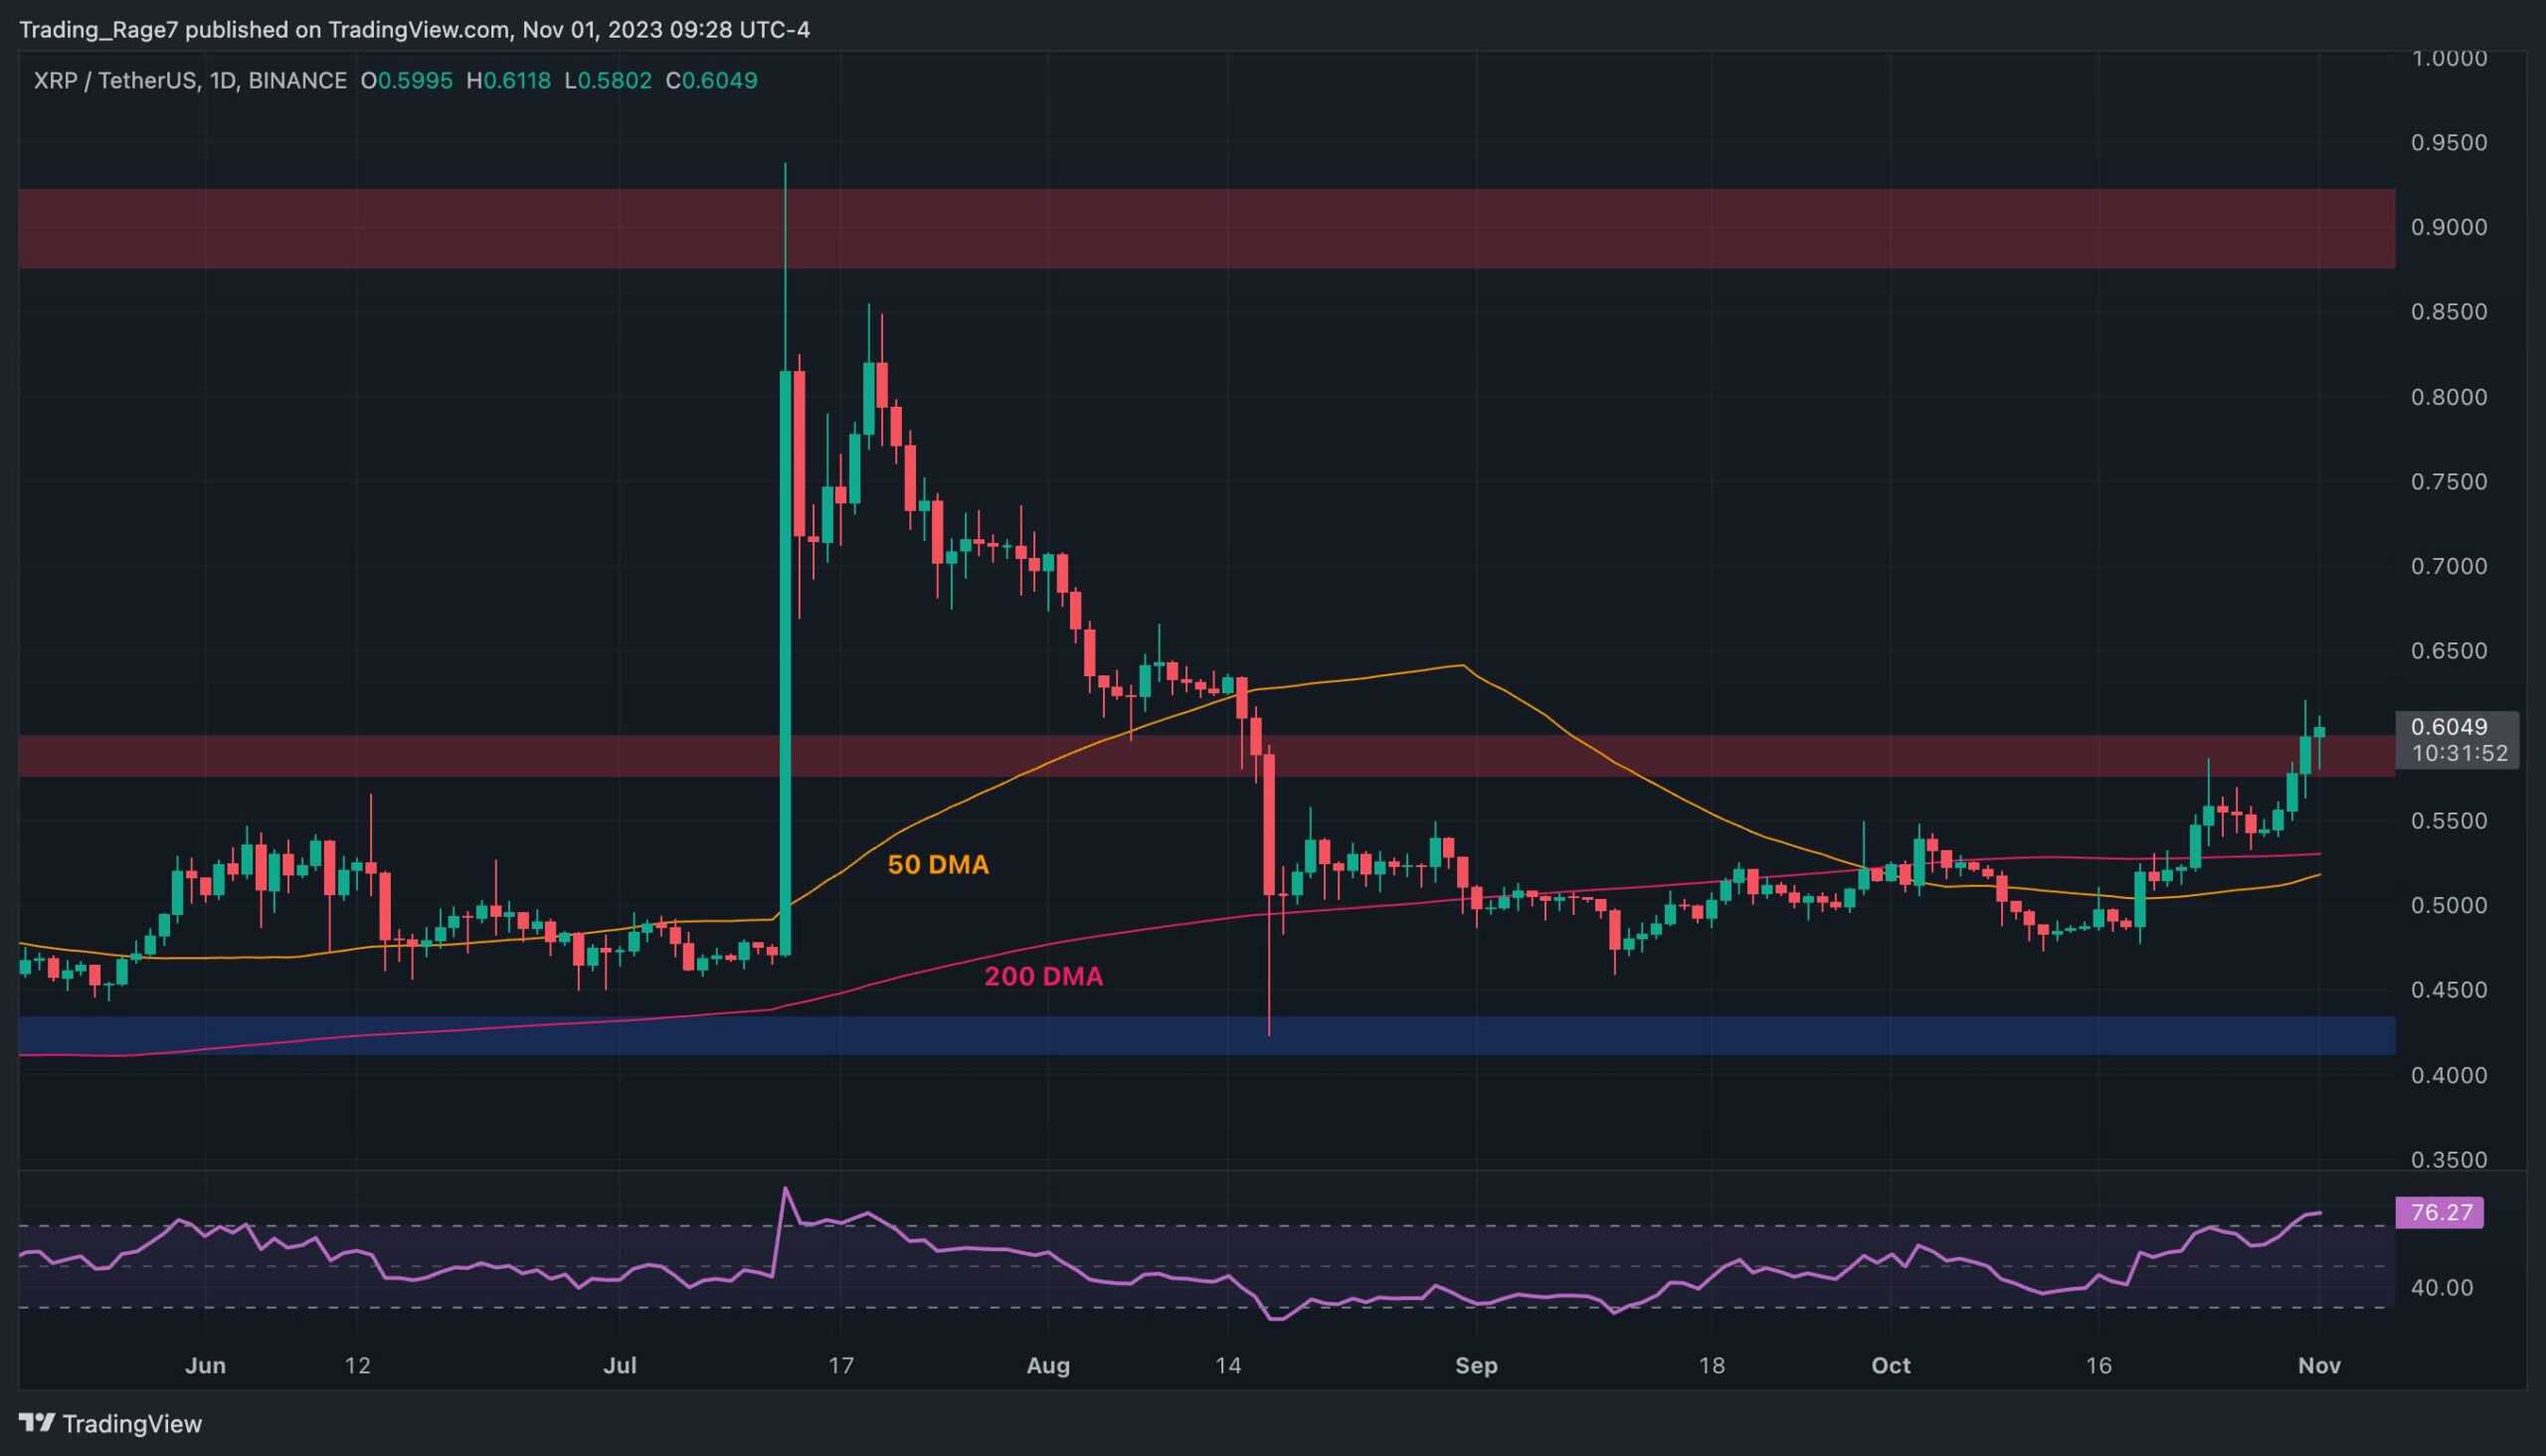
Against USDT, the price has been rallying over the last few weeks. Both the 50-day and 200-day moving averages have been broken to the upside, and the price is now piercing through the $0.6 resistance level. The relative strength index has also been rising recently, entering the overbought region.
This could be interpreted as a worrying signal as it increases the probability of a bearish reversal in the short term.
The potential pullback can occur either after a breakout above the $0.6 level or before. Yet, with the 200-day and 50-day moving averages located around the $0.52 and $0.53 levels, investors can be hopeful that any correction will be short-lived.
The BTC Paired Chart
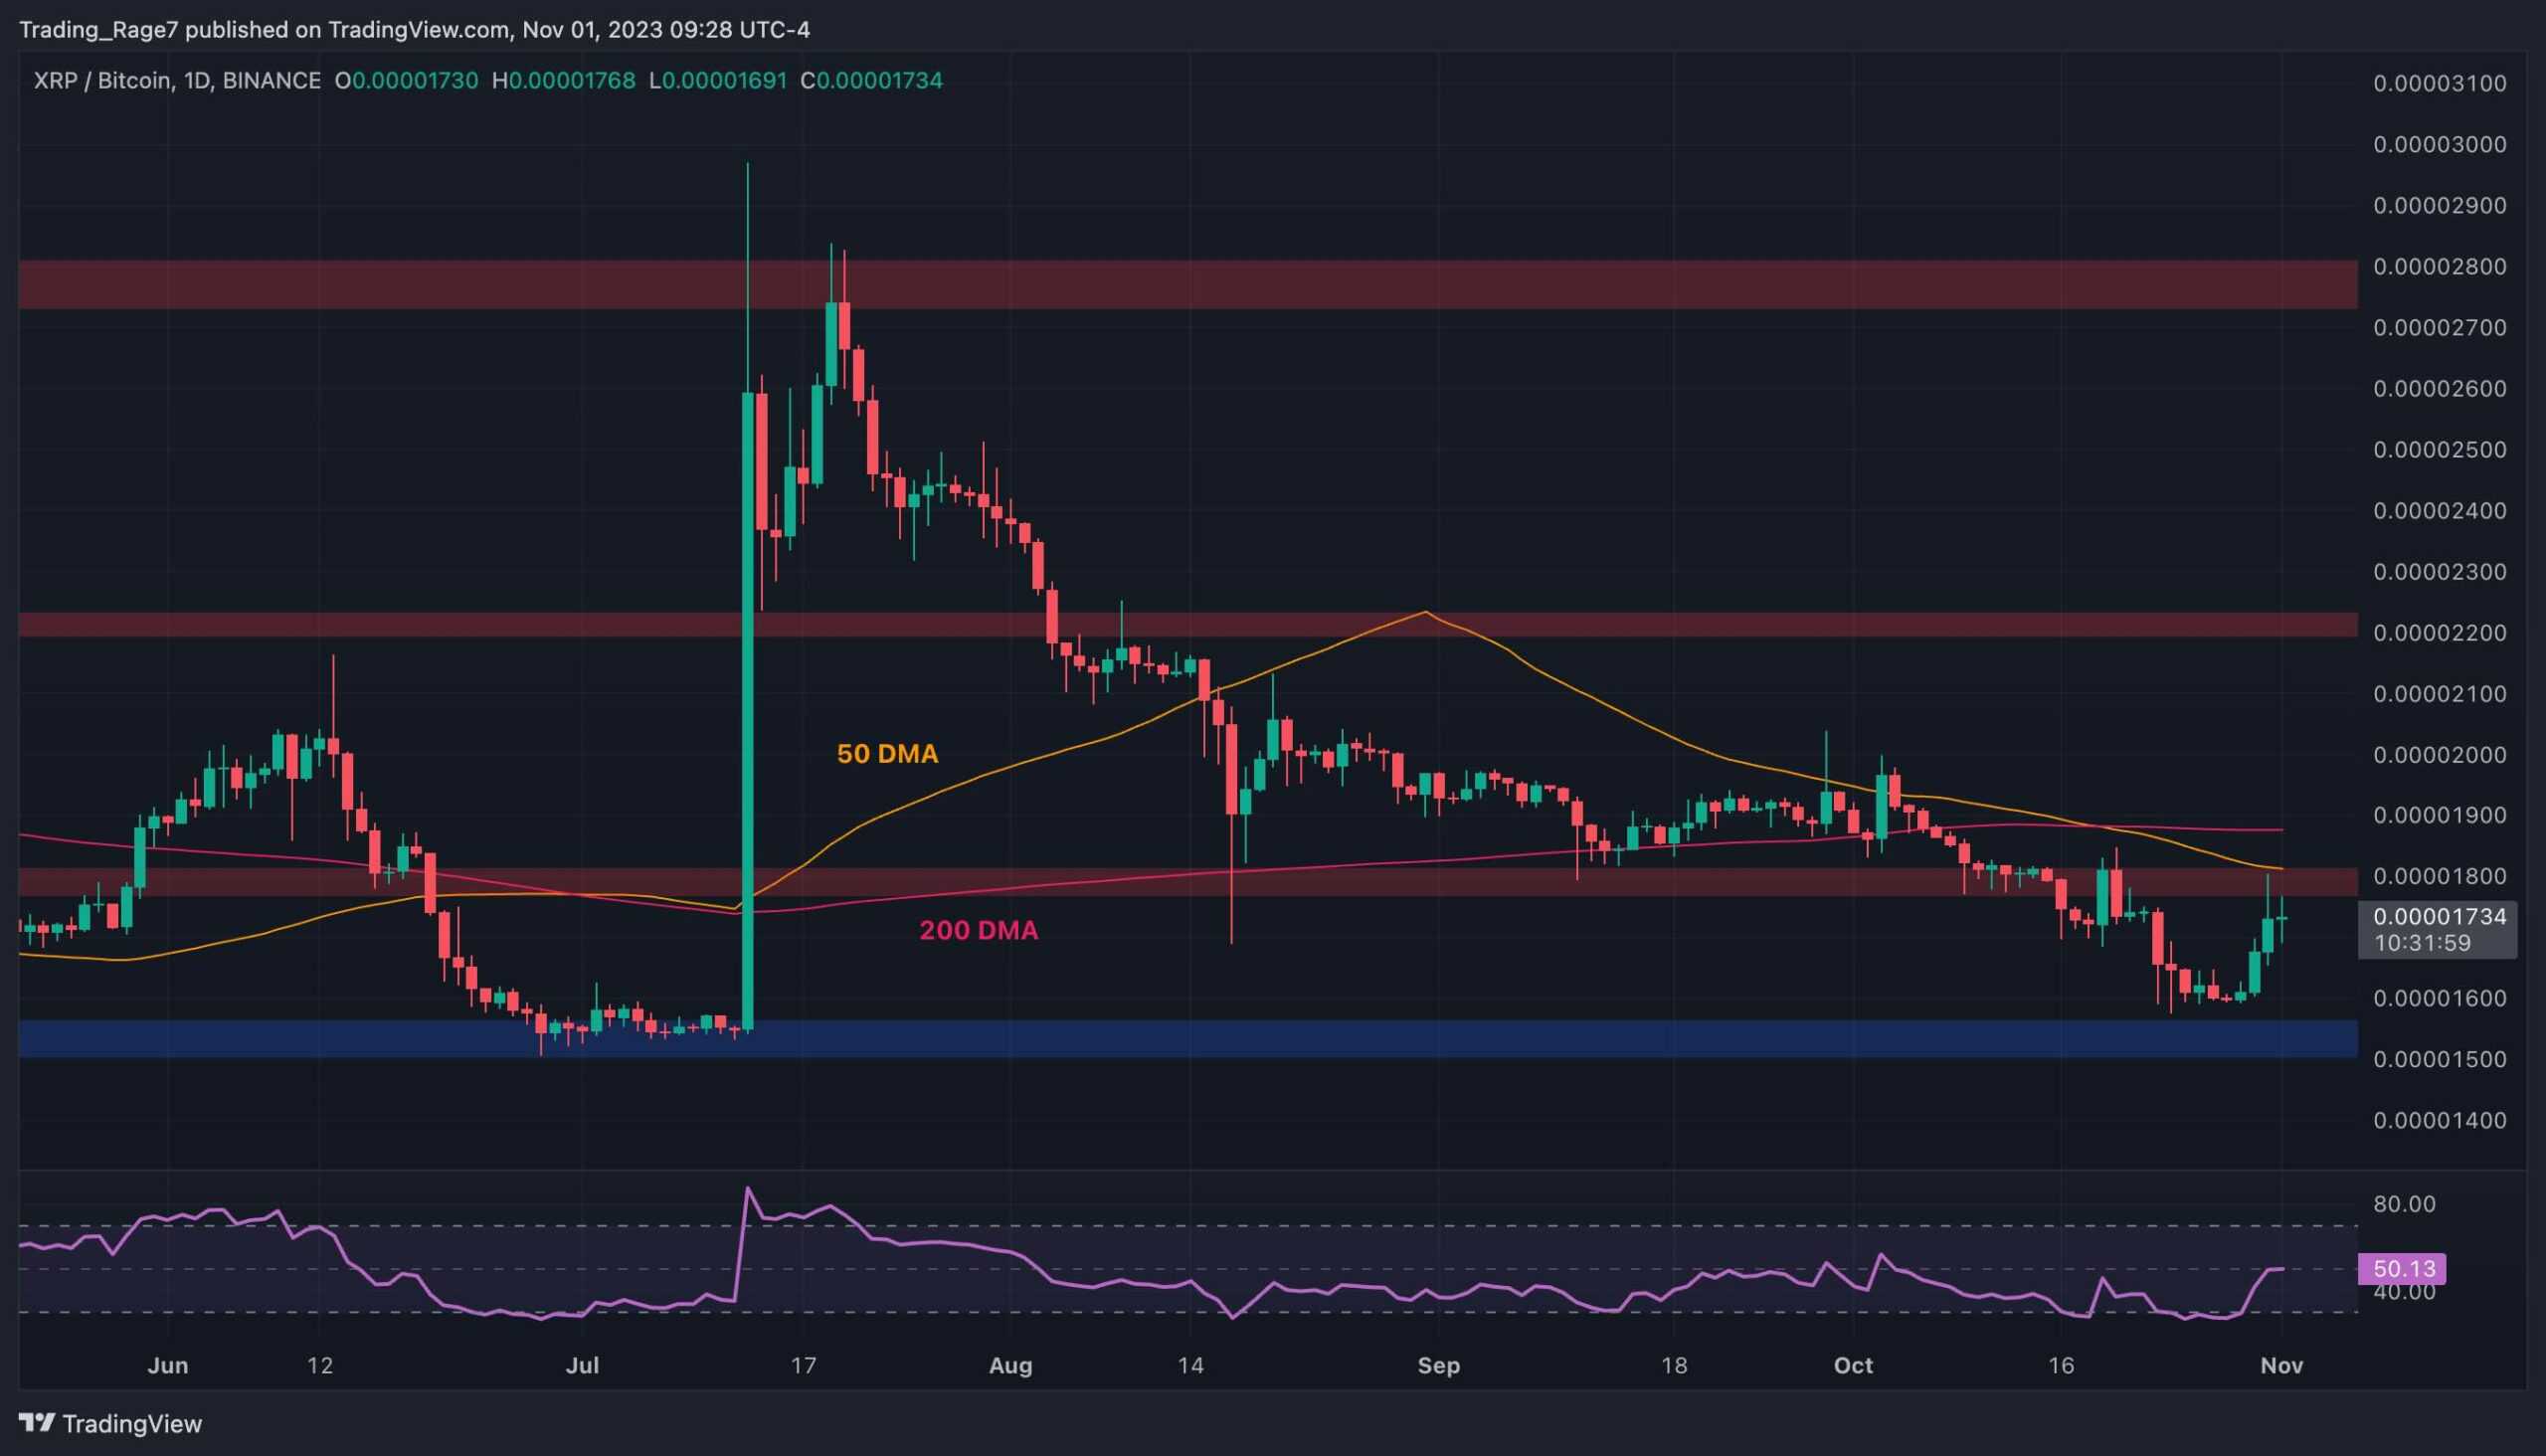
Looking at the BTC pair, things seem even more interesting. The price has rebounded from the 1500 SAT support area and is currently testing both the 1800 SAT resistance level and the 50-day moving average near the same price zone.
In case a bullish breakout occurs, the 200-day moving average trending near the same area would be the next obstacle. In case the price rises above the 200-day moving averages, a rally toward the 2200 SAT area could be expected in the coming weeks.
The post XRP Pumps Above $0.6 but is a Correction Next? (Ripple Price Analysis) appeared first on CryptoPotato.

