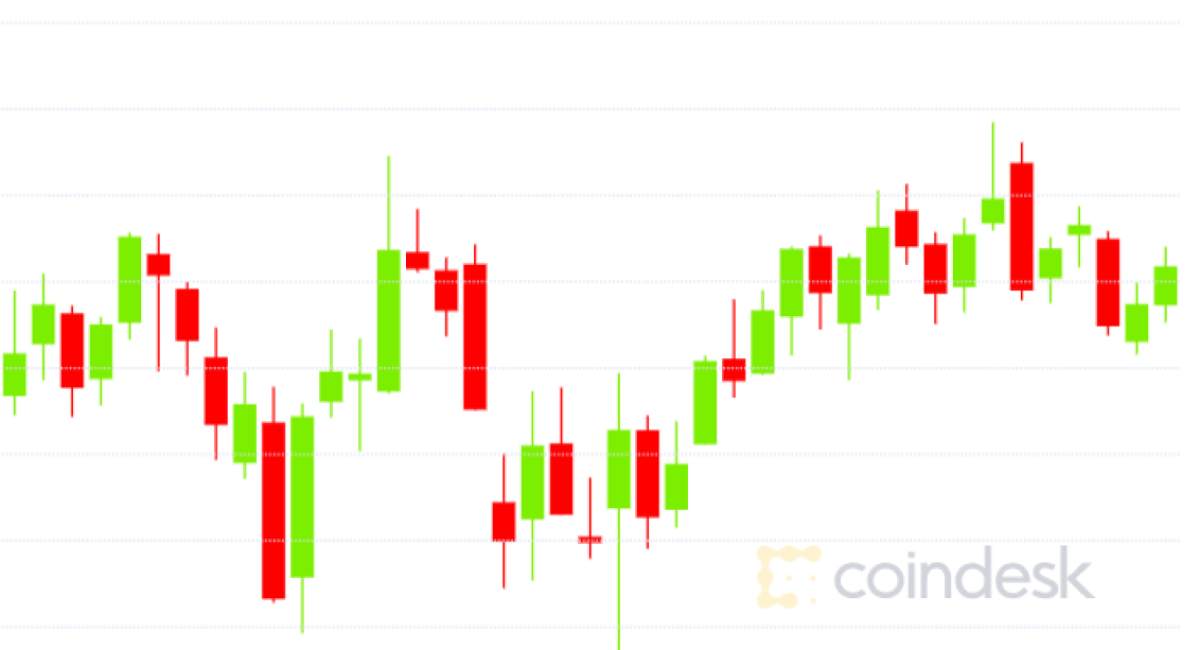
XRP Price Exits Downtrend to Hit Three-Week High

XRP has been on the offensive, having ended a 3.5-month-long downtrend with a move to three-week highs.
The world’s third-largest cryptocurrency by market capitalization clocked a high of $0.2993 Tuesday, the highest level since Sept. 21, according to CoinDesk’s price index.
As of writing, XRP has pulled back slightly and is changing hands at $0.2879, representing a 3.8 percent drop on the day after reaching its local peak.
Notably, prices are up more than 25 percent from the low of $0.2343 registered on Sept. 26. Further, XRP is the third-best performing top 10 cryptocurrency of the last seven days with a 2.2 percent gain.
Binance coin, up 16 percent, is the top gainer, while litecoin has dropped 4.2 percent and is the worst-performing top-10 cryptocurrency of the last seven days.
Bitcoin, the largest cryptocurrency by market value, is currently reporting a meager 0.06 percent gain on a seven-day basis. Also, BTC has been up just 4.5 percent from the recent lows near $7,750.
XRP’s price may continue to outperform BTC in the near future as the cryptocurrency has found acceptance above the widely tracked 100-day moving average for the first time since July 10. The key average is currently seen at $0.2854.
Meanwhile, bitcoin’s 100-day MA is currently located at least $1,500 above its price of $8,175.
Further, XRP’s technical charts are reporting a bullish breakout, as seen below.
Daily chart

XRP jumped six percent on Monday, confirming an upside break of a symmetrical triangle represented by trend lines connecting Sept. 18 and Oct. 13 highs and Sept. 24 and Oct. 13 lows.
The previous breakout indicated the sell-off from June 26’s high of $0.4923 had ended and the path of least resistance was to the higher side.
That outlook has been halted in the immediate short term, courtesy of a small sell-off witnessed Tuesday at 14:00 UTC that brought prices back to prior resistances seen Oct. 8 and Oct. 9.
However, XRP remains bullish in the mid-term should prices remain above the aforementioned 100-day moving average at $0.2854.
As a result, the next major resistance at $0.3218 (Sept. 18 high) stands exposed. The short-term bullish case looks stronger if we take into account the above-50 reading on the relative strength index and the higher bars on the MACD histogram, an indicator used to gauge trend strength.
The recent price rise has excited the investor community and prominent traders such as Bagsey expect the cryptocurrency to trade better bid in the near future.
Even so, there is merit in being cautious, as bitcoin – the anchor for broader markets – is looking weak. If the top cryptocurrency slides, XRP will likely follow suit once more, trapping buyers on the wrong side of the markets.
That could yield a notable price drop. After all, failed breakouts are powerful bearish reversal signals, as noted by popular analyst Nicola Duke.
Disclosure: The author holds no cryptocurrency assets at the time of writing.
Sebastian Sinclair contributed reporting.
XRP image via Shutterstock; charts by Trading View


