XRP Price Analysis: Ripple Eyes $0.40 But Will Bears Propel Another Drop?
The crypto market is in the green today. XRP has experienced a price increase along with the largest cryptocurrencies. However, the bearish trend will not be reversed until the price breaks out of the three-month consolidation.
Technical Analysis
By: Grizzly
The Daily Chart
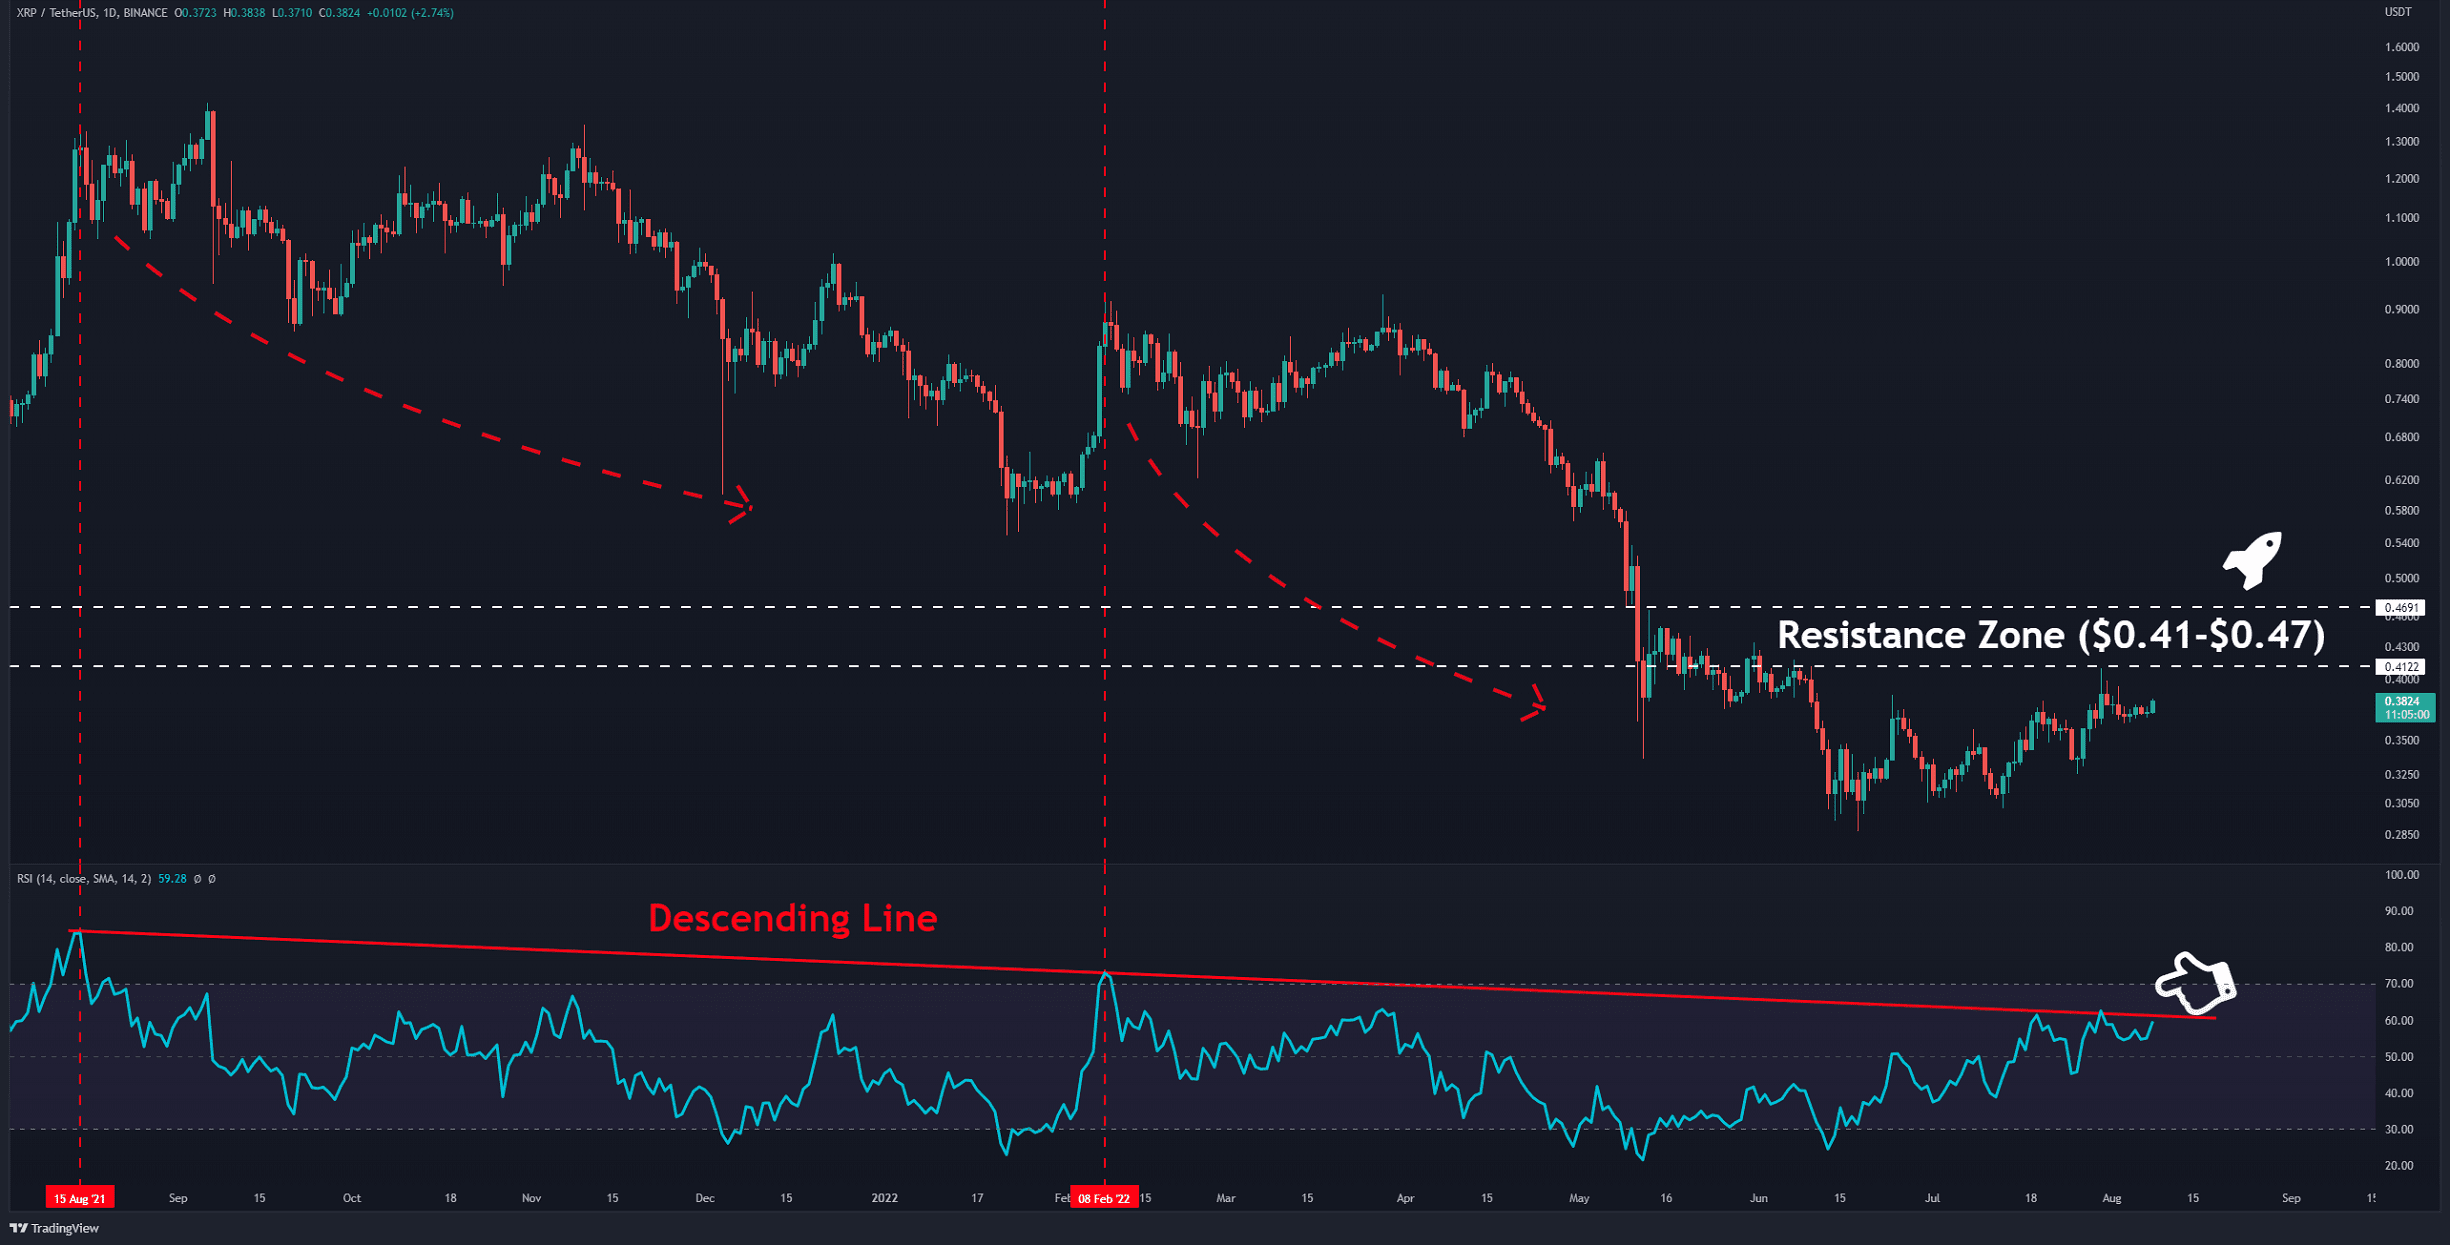
XRP has technically formed a bullish structure in the last fifty days. This structure is confirmed by the formation of higher highs and higher lows. Even so, the price is still flirting below the key resistance zone (in white). This zone is in the range of $0.41 to $0.47.
Likewise, the Relative Strength Index (RSI) is about to touch the descending line (in red) for the third time in the last two weeks. In the event that the RSI can break the resistance and move above 70 while the bulls simultaneously drive the price above the resistance zone, the bearish sentiment will likely fade in the short term. The buying pressure will probably increase. In this scenario, the pair can extend to the target of $0.55.
Contradicting this assumption, if the RSI cannot overcome the red resistance similar to August 2021 and February 2022 (vertical red line), the bears will gain the upper hand in the market. It can drag XRP down to $0.33.
Considering that the bulls hold their ground, the resistance zone is expected to be retested. It remains to be seen whether the bears will retreat there.
Key Support Levels: $0.33 & $0.30
Key Resistance Levels: $0.41 & $0.47
Daily Moving Averages:
MA20: $0.36
MA50: $0.34
MA100: $0.38
MA200: $0.56

The XRP/BTC Chart
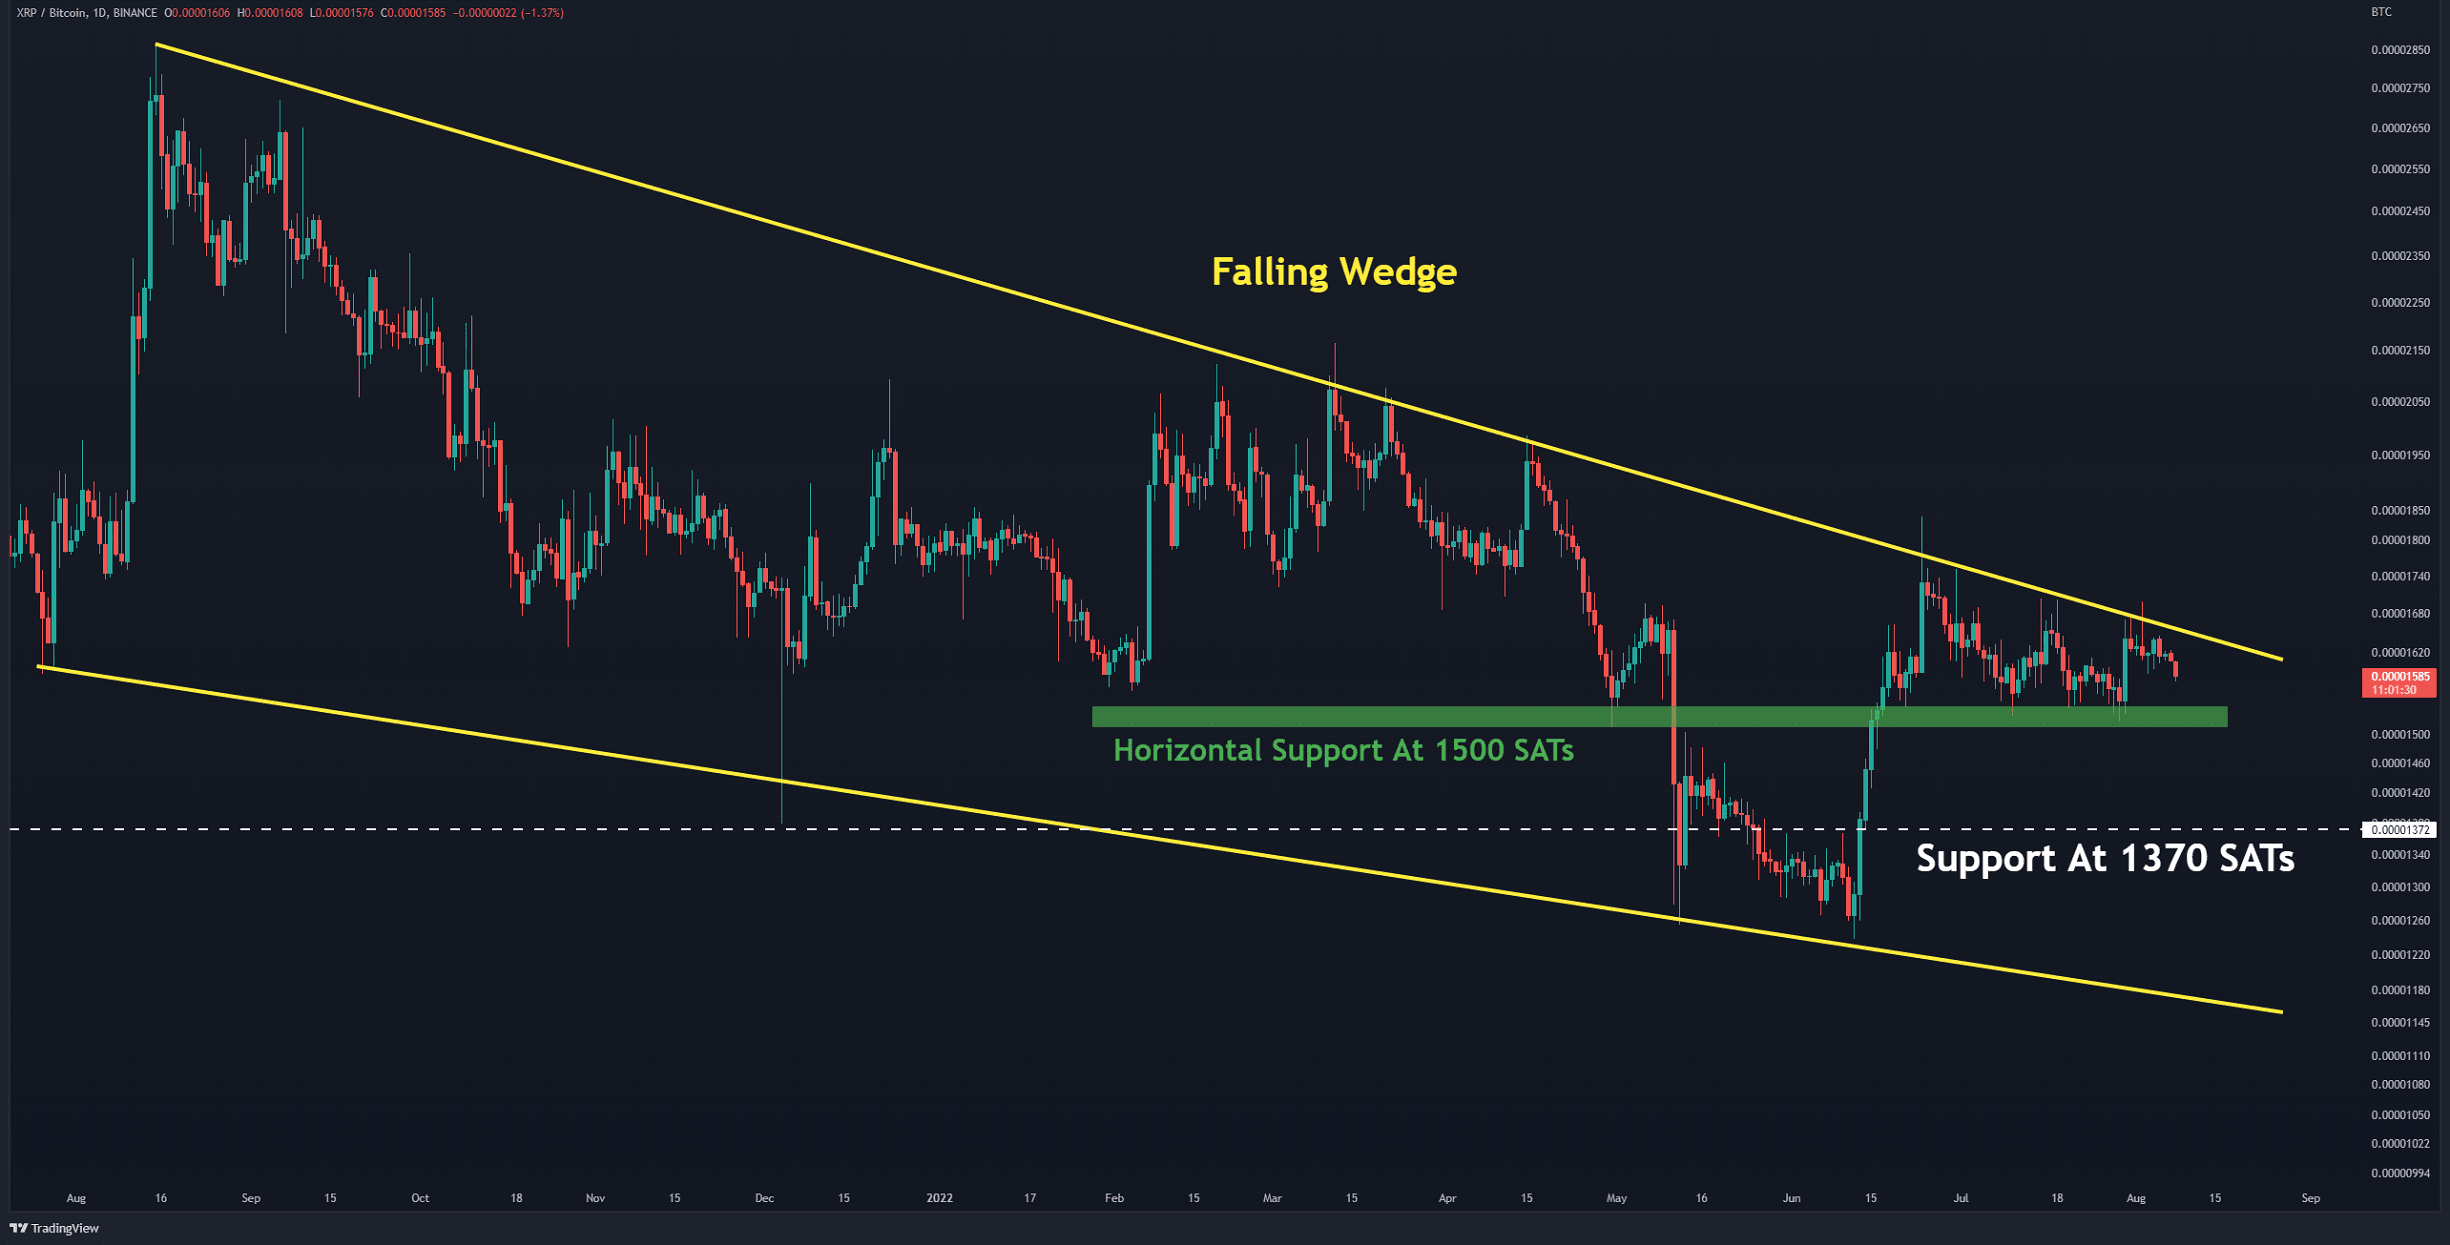
Against Bitcoin, the price is moving down inside a falling wedge (in yellow). The pair have hit this wedge top three times in the last 45 days, but the bears are defending it aggressively. On the other hand, the horizontal support at 1500 SATs (in green) has been breached four times. This support will break down if reached 1-2 times more. In this case, the bears can shoot the price towards 1370 SATs (in white). A breakout from the wedge can signal the start of a bullish rally. 2000 SATs is the target of this movement.
Key Support Levels: 1500 SATs & 1370 SATs
Key Resistance Levels: 1700 SATs & 2100 SATs

The post XRP Price Analysis: Ripple Eyes $0.40 But Will Bears Propel Another Drop? appeared first on CryptoPotato.


