XRP Price Analysis: Choppy Action Continues as Ripple Loses $0.4 Level
Exactly one month has passed since the market crashed following the failure of the Terra ecosystem. Over this period, XRP has been trapped within a consolidation area. According to historical records, the 200 DMA can be utilized as a reference to estimate the momentum in the short term.
Technical Analysis
By Grizzly
The Daily Chart
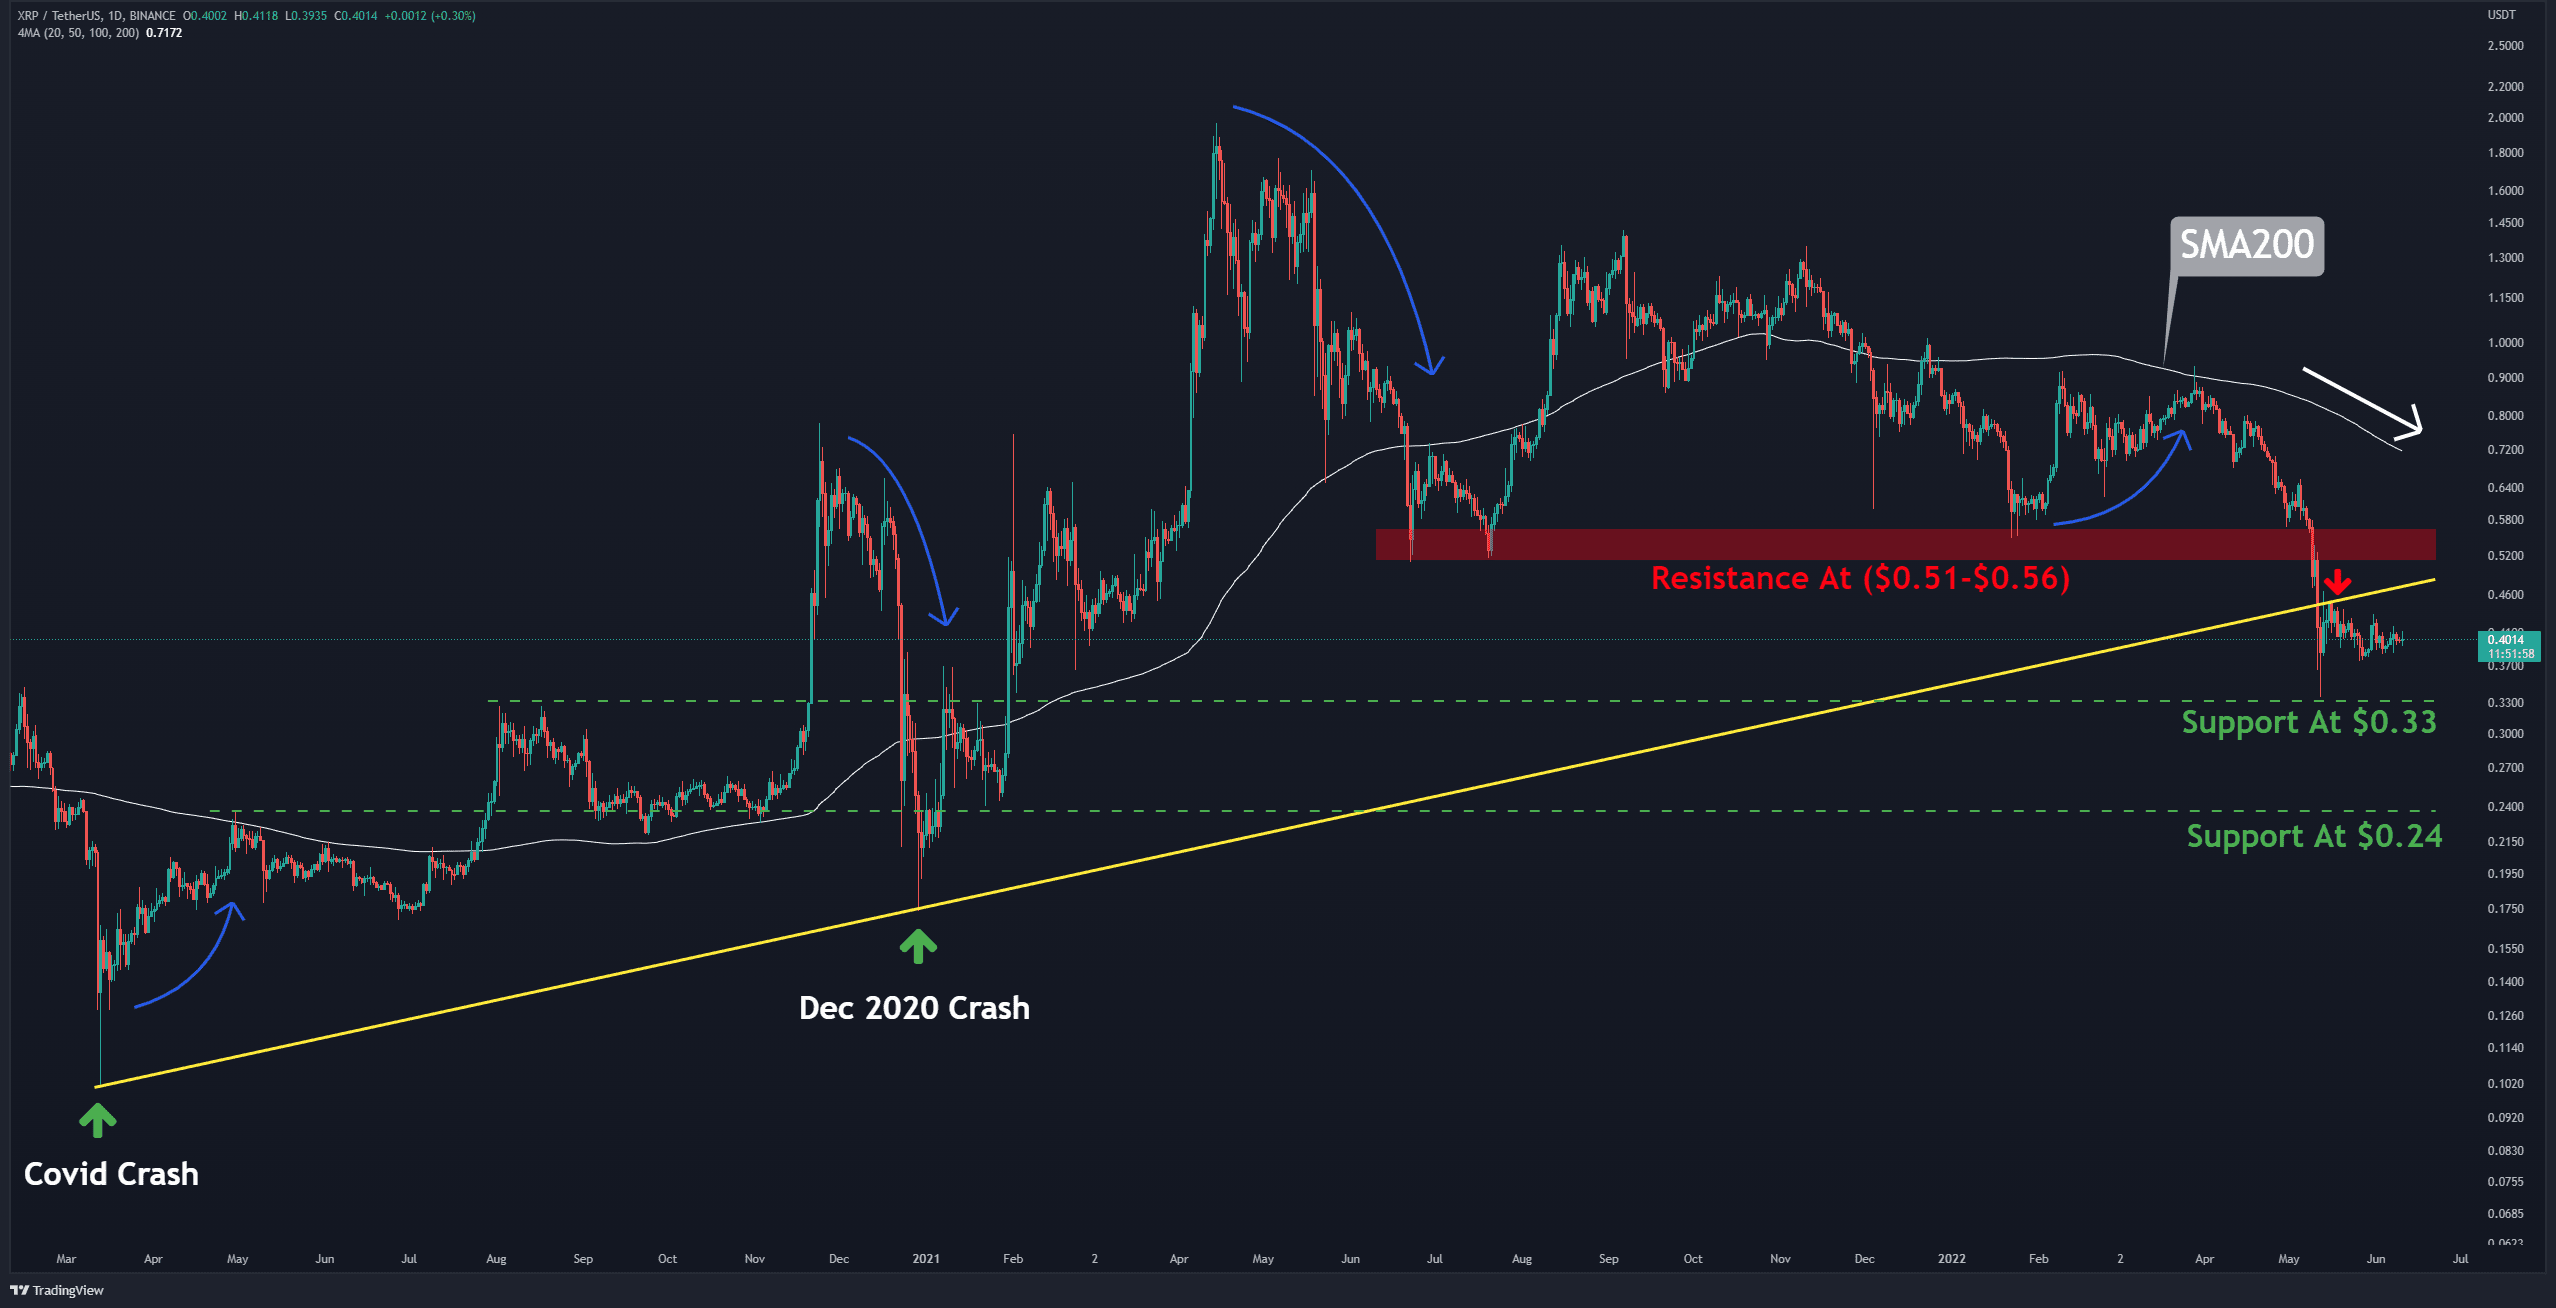
On the daily timeframe, the bears were able to push the cryptocurrency below the ascending line (in yellow) that has accompanied the price since the Covid Crash. Buyers were unsuccessful in their first attempt to break above this line. XRP is currently trading above the horizontal support at $0.33.
The interesting point to highlight here is interaction with 200 DMA. Historically, whenever the price has fallen below this moving average, the bulls have tried to reclaim it back. This pattern was repeated multiple times since the Covid Crash.
The 200 DMA is at $0.71 now, while the rate at which the 200 DMA falls has slowed down (in white). For the bulls to retest this moving average, they must first overcome the resistance at $0.5.

If this recent sideways trend continues, the probability of hitting the mentioned resistance range is relatively high. Just as any uptrend is not permanent, downtrends will eventually see upside corrections. In this scenario, if the bulls defend the horizontal support at $0.33, an attempt to reclaim the 200 DMA can be considered a probable next step.
Key Support Levels: $0.33 & $0.24
Key Resistance Levels: $0.46 & $0.55
Moving Averages:
MA20: $0.40
MA50: $0.48
MA100: $0.63
MA200: $0.71
The XRP/BTC chart
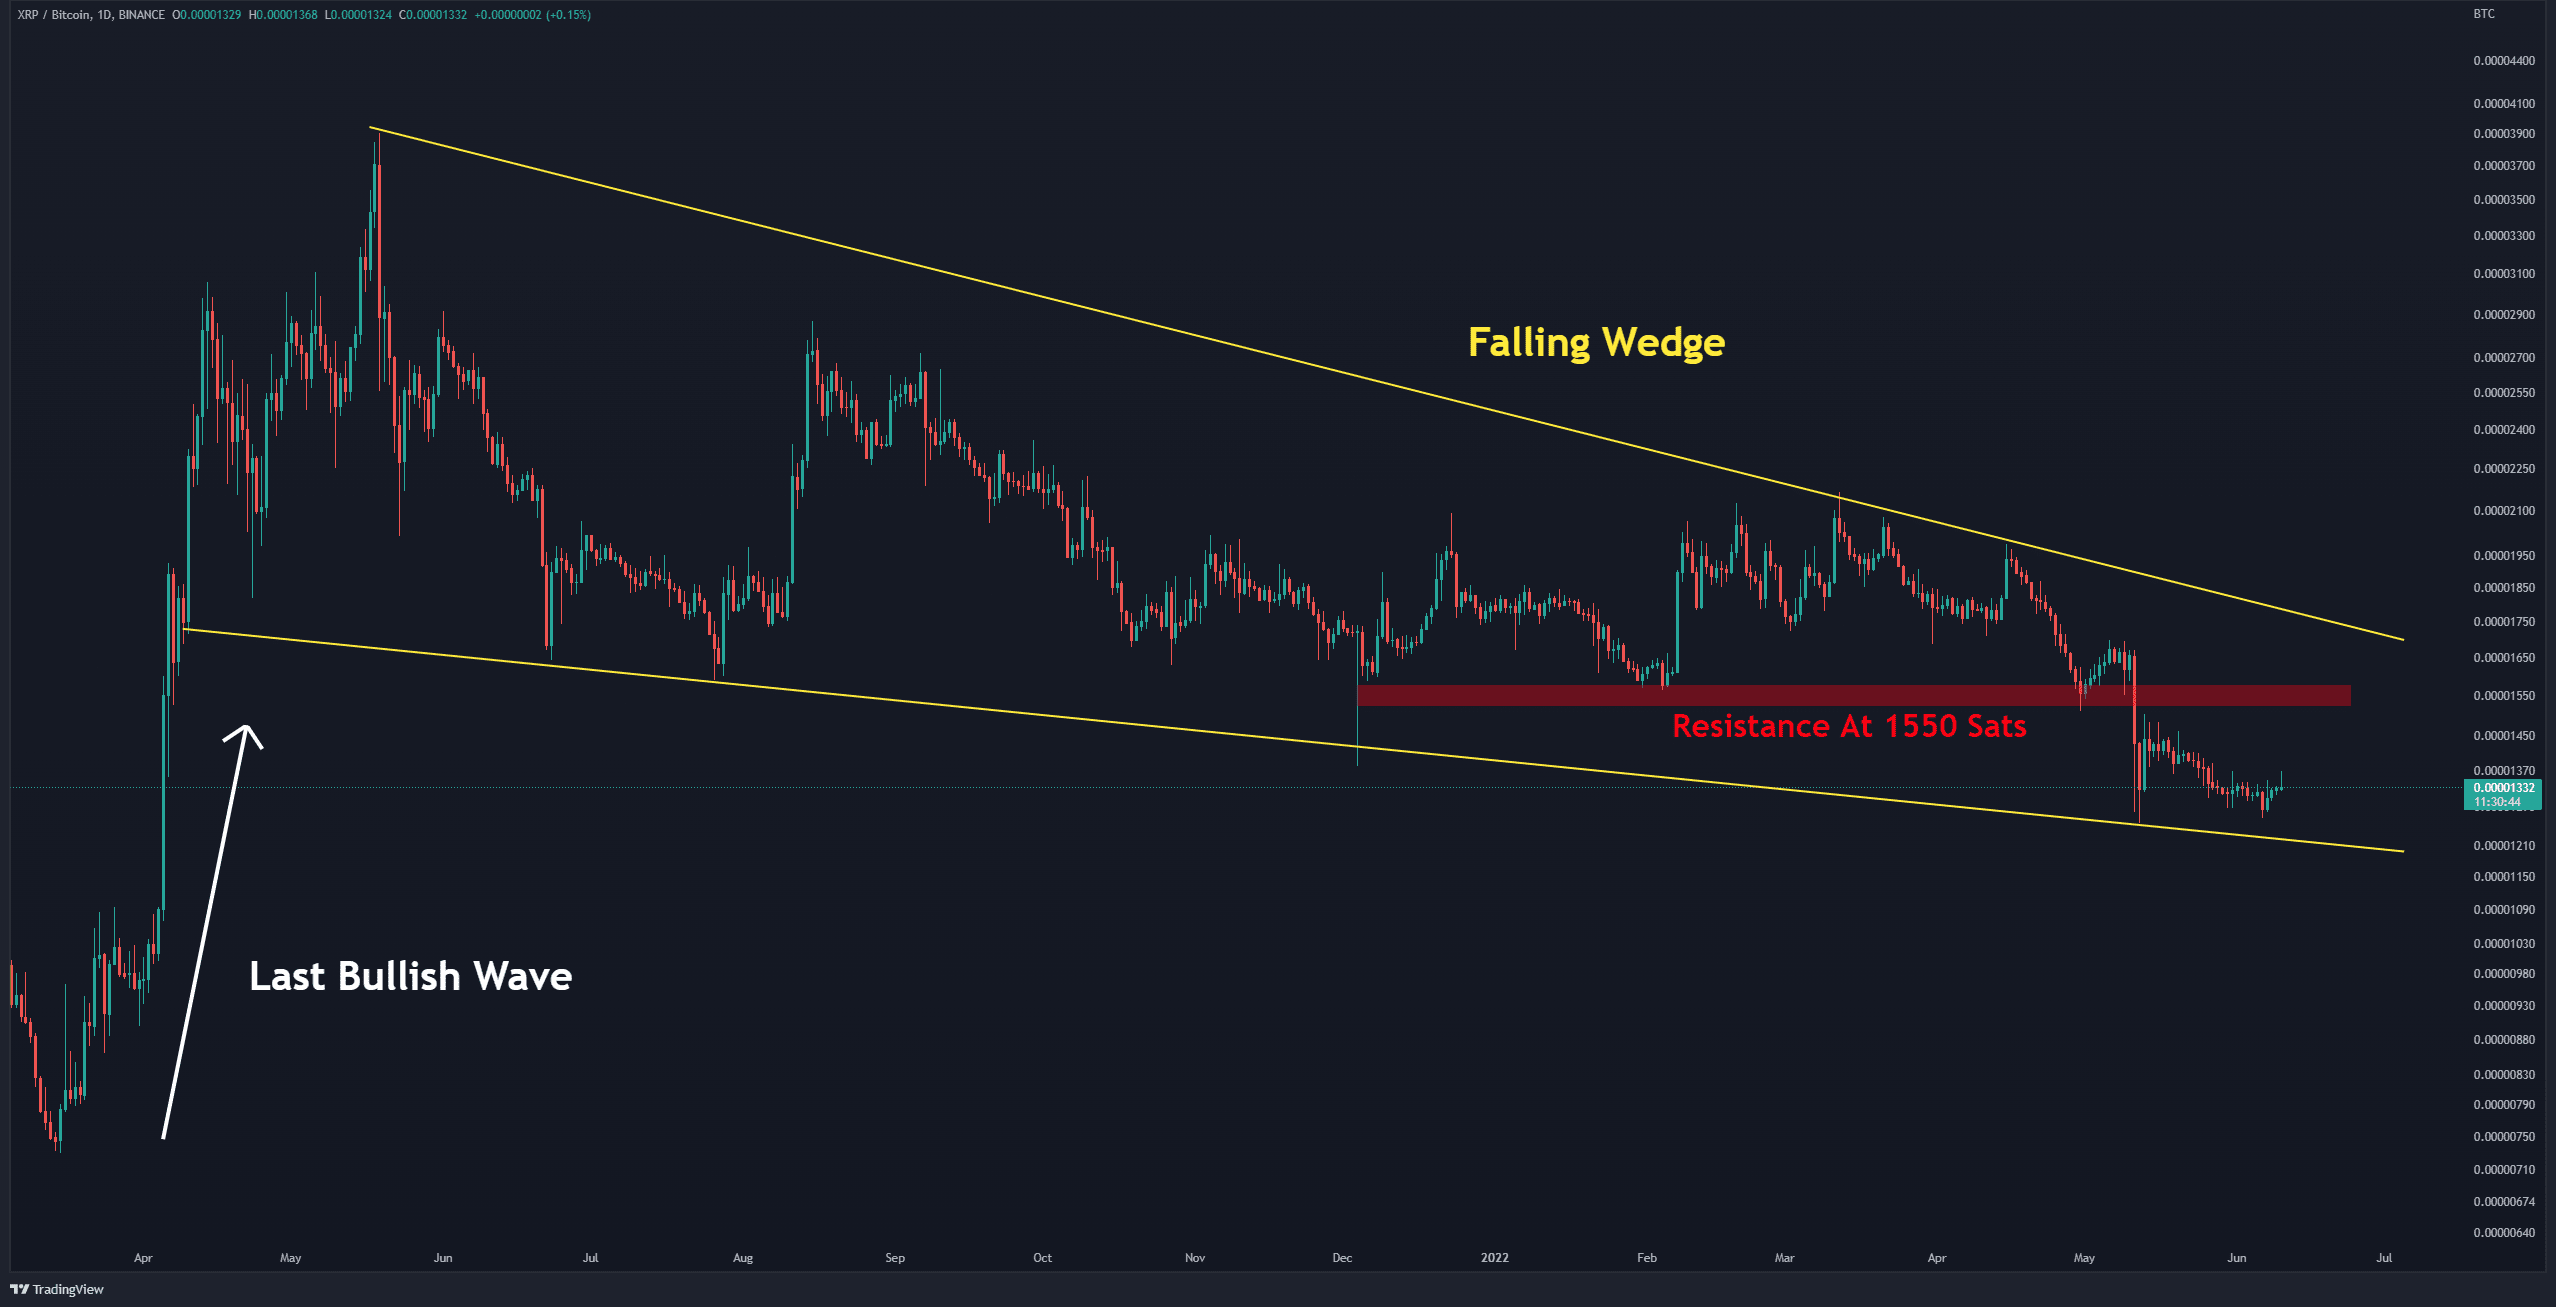
Against BTC, the price has corrected more than 60% of the last peak in more than a year. It is currently fluctuating inside a falling wedge (in yellow), which technically is a bullish pattern.
In an optimistic scenario, the bearish momentum of the recent sharp drop will decline. After that, the price could start recovering to 1550 sats. Failing to accomplish this could result in a further drop toward the below-mentioned support levels.
Key Support Levels: 1250 Sats & 1100 Sats
Key Resistance Levels: 1550 Sats & 1700 Sats


