XRP Needs to Break This Level for the Bull Run to Resum: Ripple Price Analysis
Ripple has recently exhibited subdued price movements, characterized by a period of quiet sideways consolidation.
Nonetheless, the XRP price is close to a significant support region marked by the presence of the 100—and 200-day moving averages, fostering expectations of a modest bullish reversal in the medium term.
Ripple Price Analysis
By Shayan
The Daily Chart
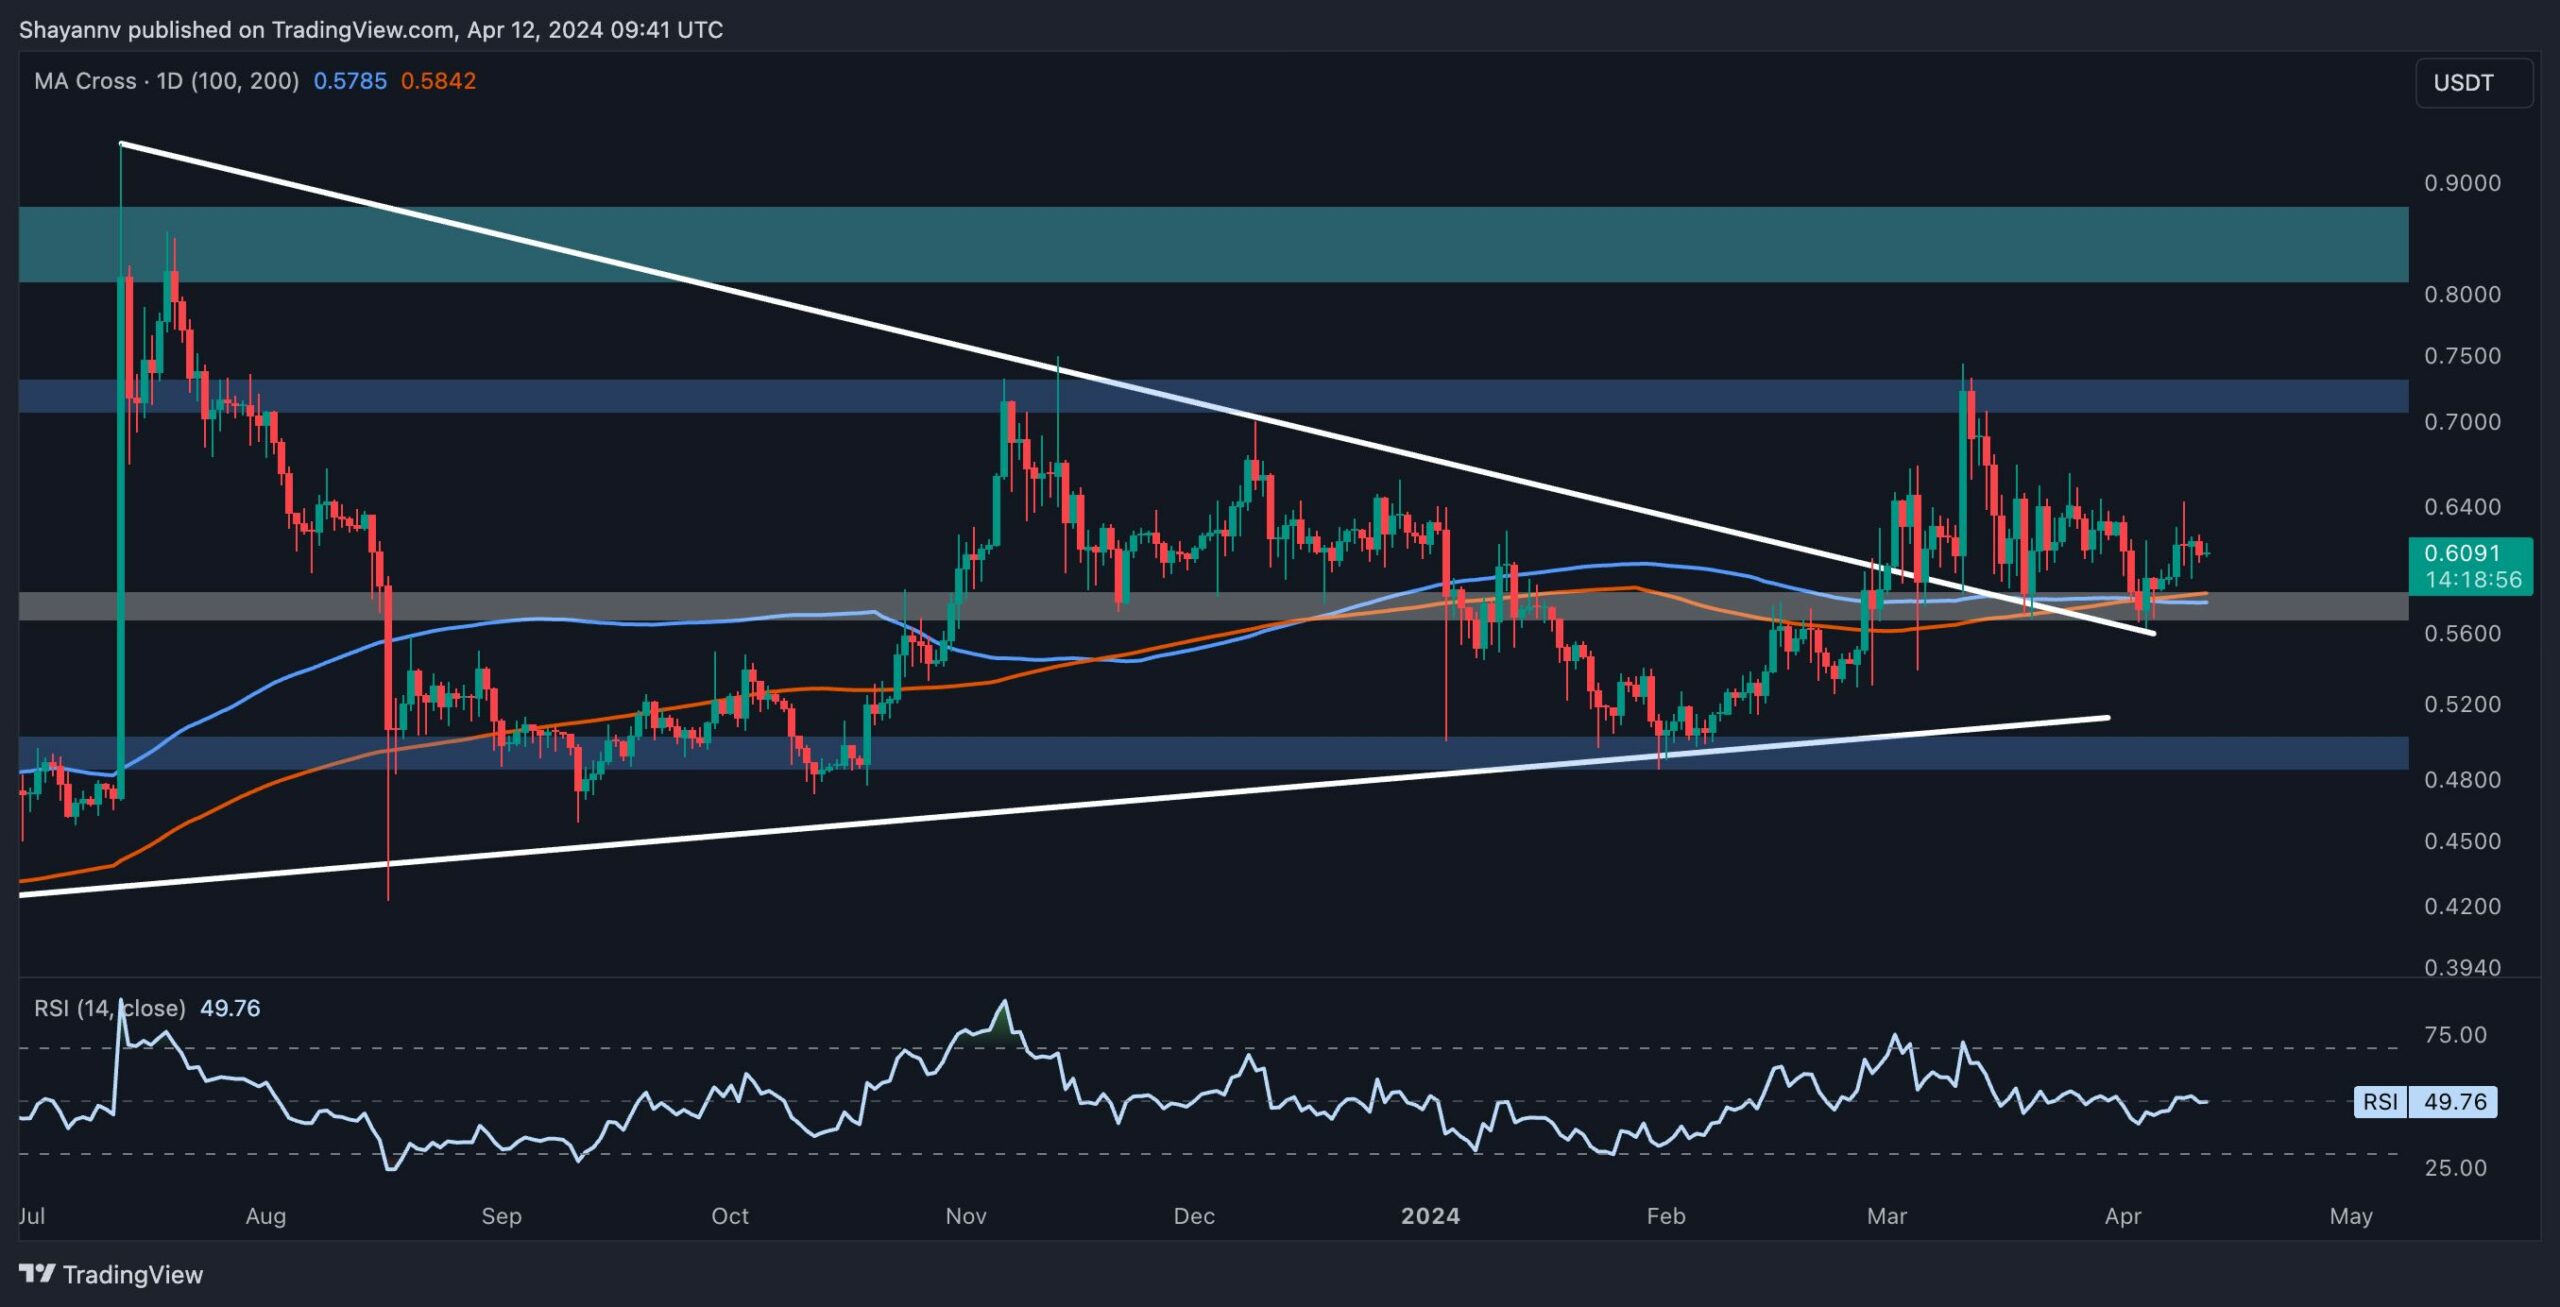
Upon careful examination of the daily chart, it becomes evident that following a recent substantial decline, the price has settled around a pivotal support region encompassing the notable 100 and 200-day moving averages, currently situated at $0.58.
This critical range holds considerable importance, with a notable accumulation of demand observed around this level.
Consequently, a period of sideways movement is anticipated in the short term as the price oscillates near this crucial level, ultimately propelling it towards the critical resistance at $0.66. Ripple’s long-term trajectory appears to be consolidating within a decisive range, with $0.7 serving as a crucial resistance and $0.58 as a significant support until a breakout occurs.
The 4-Hour Chart
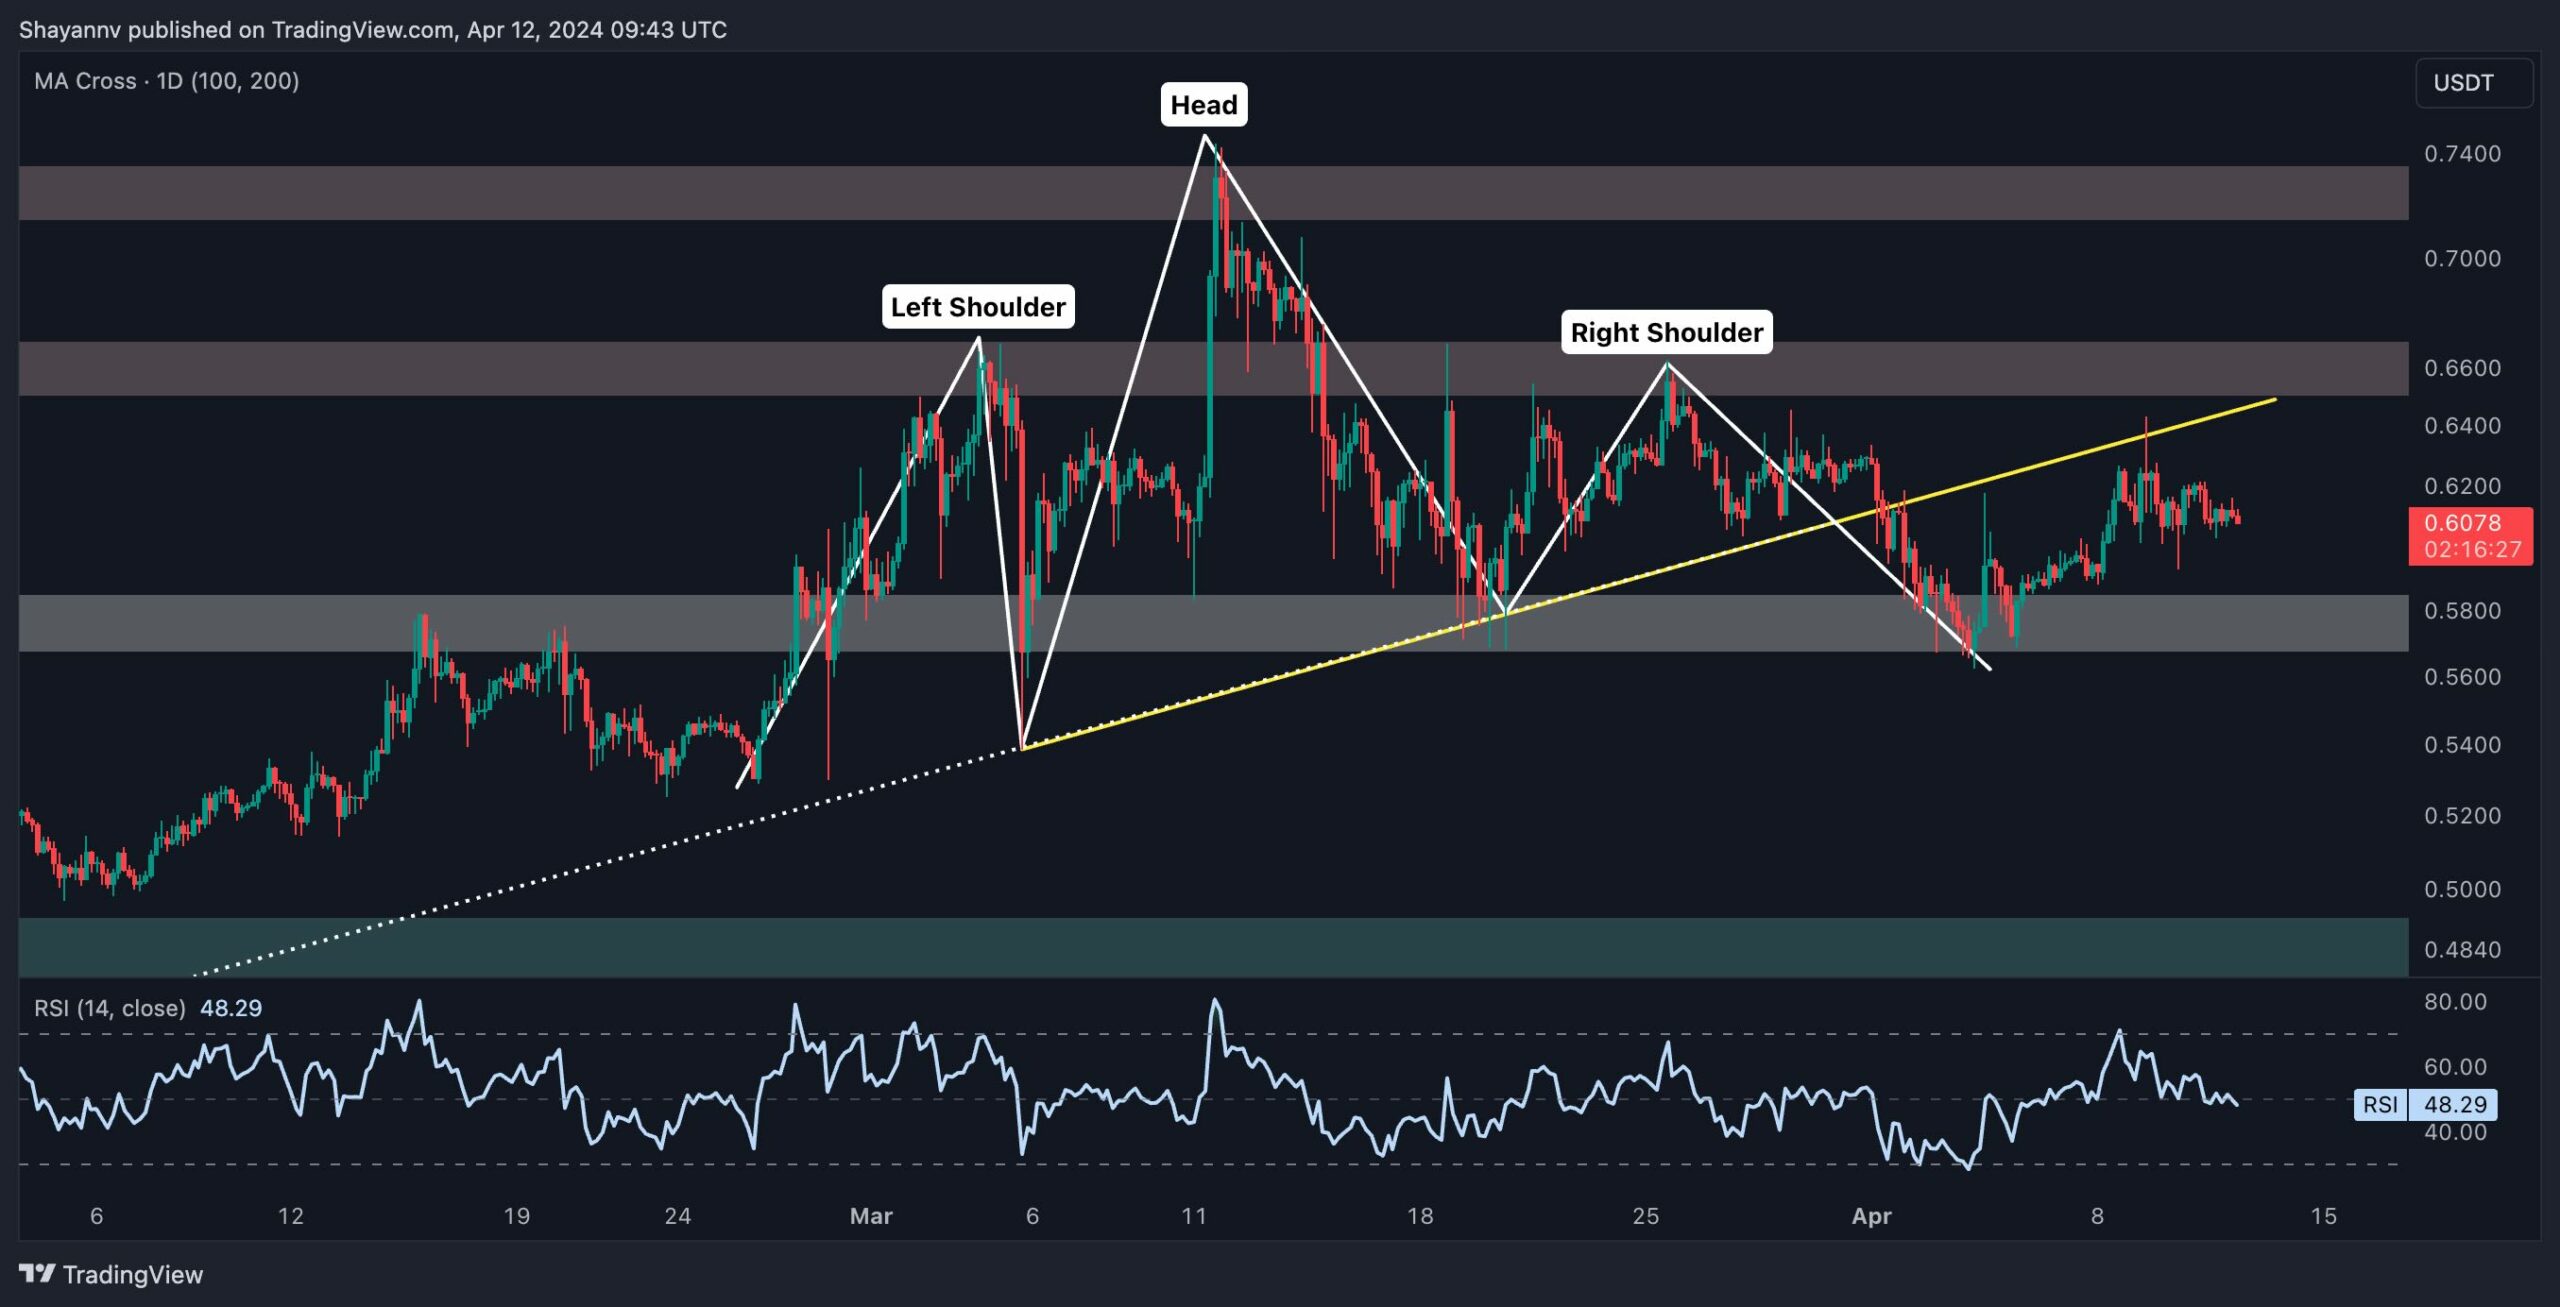
A closer inspection of the 4-hour chart unveils notable fluctuations in Ripple’s price, with the formation of a potential head-and-shoulders pattern—a well-recognized bearish reversal indicator.
However, the cryptocurrency recently experienced a downturn, breaching the pattern’s neckline and completing a pullback to the broken level. This price action suggests the intention of sellers to drive XRP lower.
Nevertheless, the cryptocurrency currently lacks sufficient momentum, increasing the likelihood of a prolonged consolidation phase near the $0.6 threshold until market dynamics favor either buyers or sellers.
In the event of a successful breach below this pivotal support level, an extended bearish trend towards the $0.55 support zone could be triggered. Conversely, should buying pressure materialize around the $0.6 range, a rebound toward the $0.66 resistance level becomes imminent.
The post XRP Needs to Break This Level for the Bull Run to Resum: Ripple Price Analysis appeared first on CryptoPotato.