XRP Loses 34% in April, Here’s What’s Next (Ripple Price Analysis)
After Ripple ended April with a 34% red candlestick, it is now on the monthly Fibonacci Retracement at 0.786, and many expect the one-year downtrend to end.
Technical Analysis
By Grizzly
The Daily Chart:
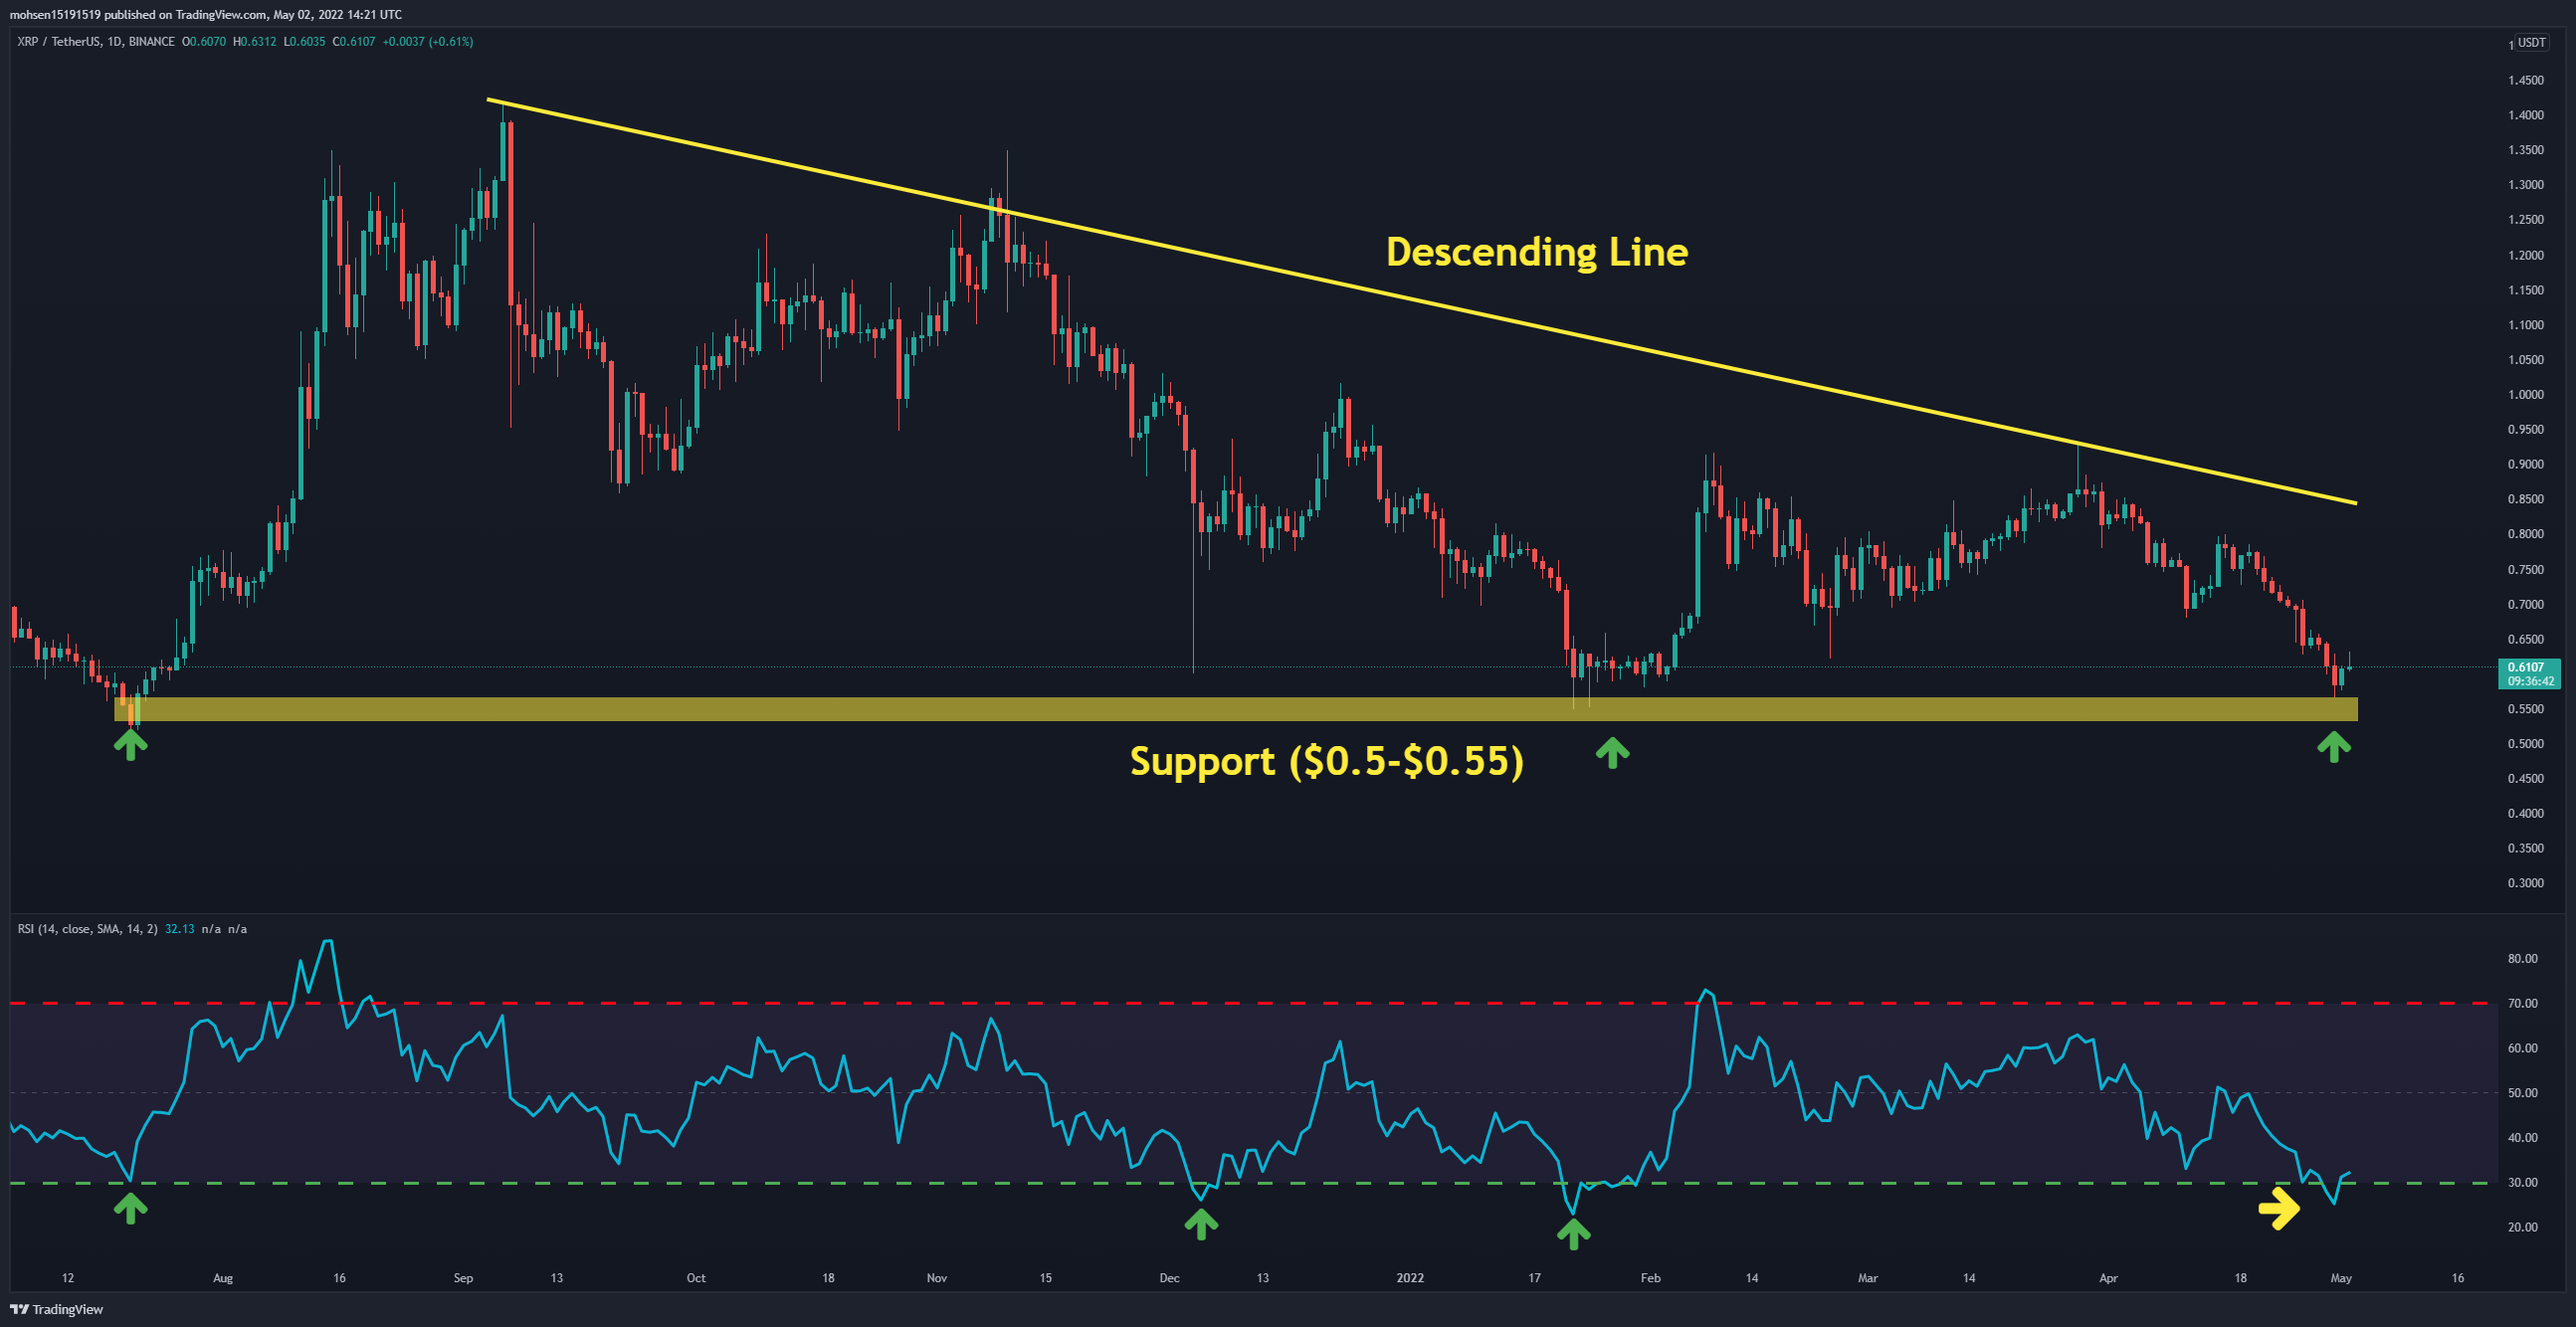
On the daily timeframe, after the price could not break the descending line at the end of March, the bears pushed XRP down by 40%. Ripple is currently on the horizontal support in the range of $0.5-$0.55, which has so far acted well.
The RSI indicator has also entered the oversold zone, which can technically be a bullish signal. Ripple might be on its way to starting an uptrend from current levels, in which case the first resistance is at $0.68 and then $0.8. If, for any reason, the bulls can not defend this support, then the price is likely to fall to around $0.4.
Moving Averages:
MA20: $0.70
MA50: $0.76
MA100: $0.74
MA200: $0.85
The 4-Hour Chart:
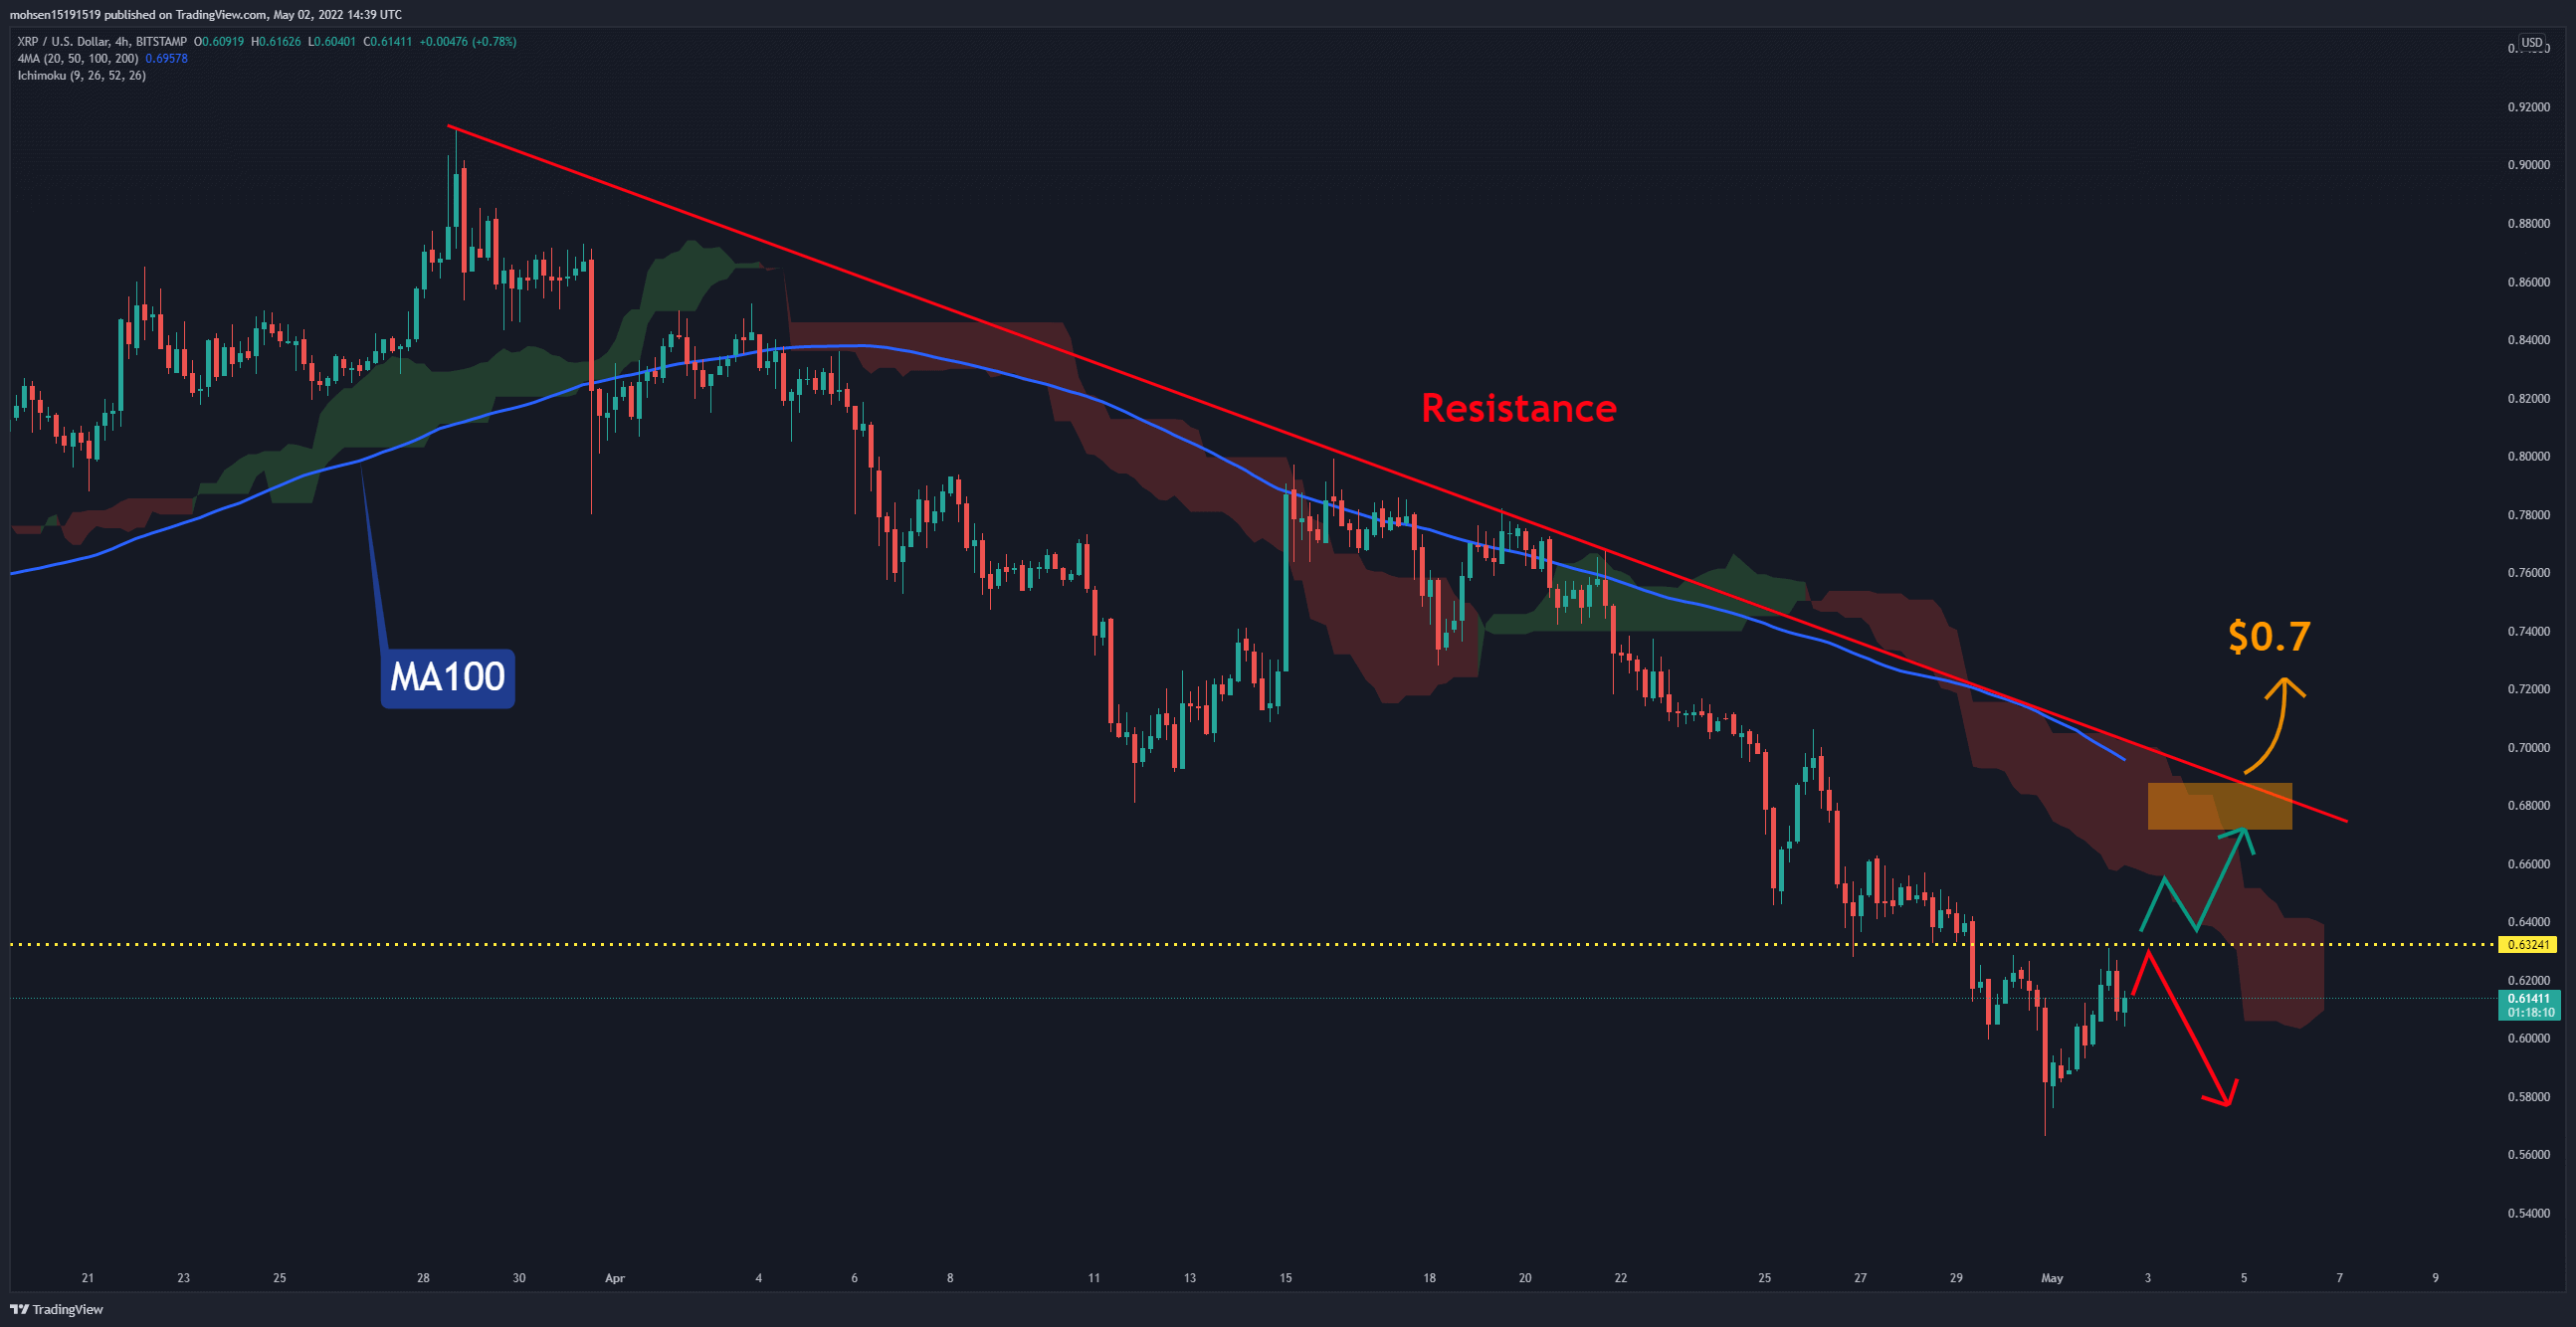
In the 4-hour timeframe, the first challenge for Ripple is to break the horizontal resistance (marked yellow) at $0.63, as it failed to do so in the first attempt. However, the main barrier is the intersection of Ichimoku cloud and dynamic resistance (marked red), with the MA100 at $0.7. If the price fails to cross the static resistance, the range of $0.5-$0.55 will be more likely to be retested.