XRP Eyes $0.50 Following 5% Daily Surge (Ripple Price Analysis)
Bulls have managed to keep XRP on the upside and appear ready to take the price above $0.50 again.
Key Support levels: $0.44
Key Resistance levels: $0.55
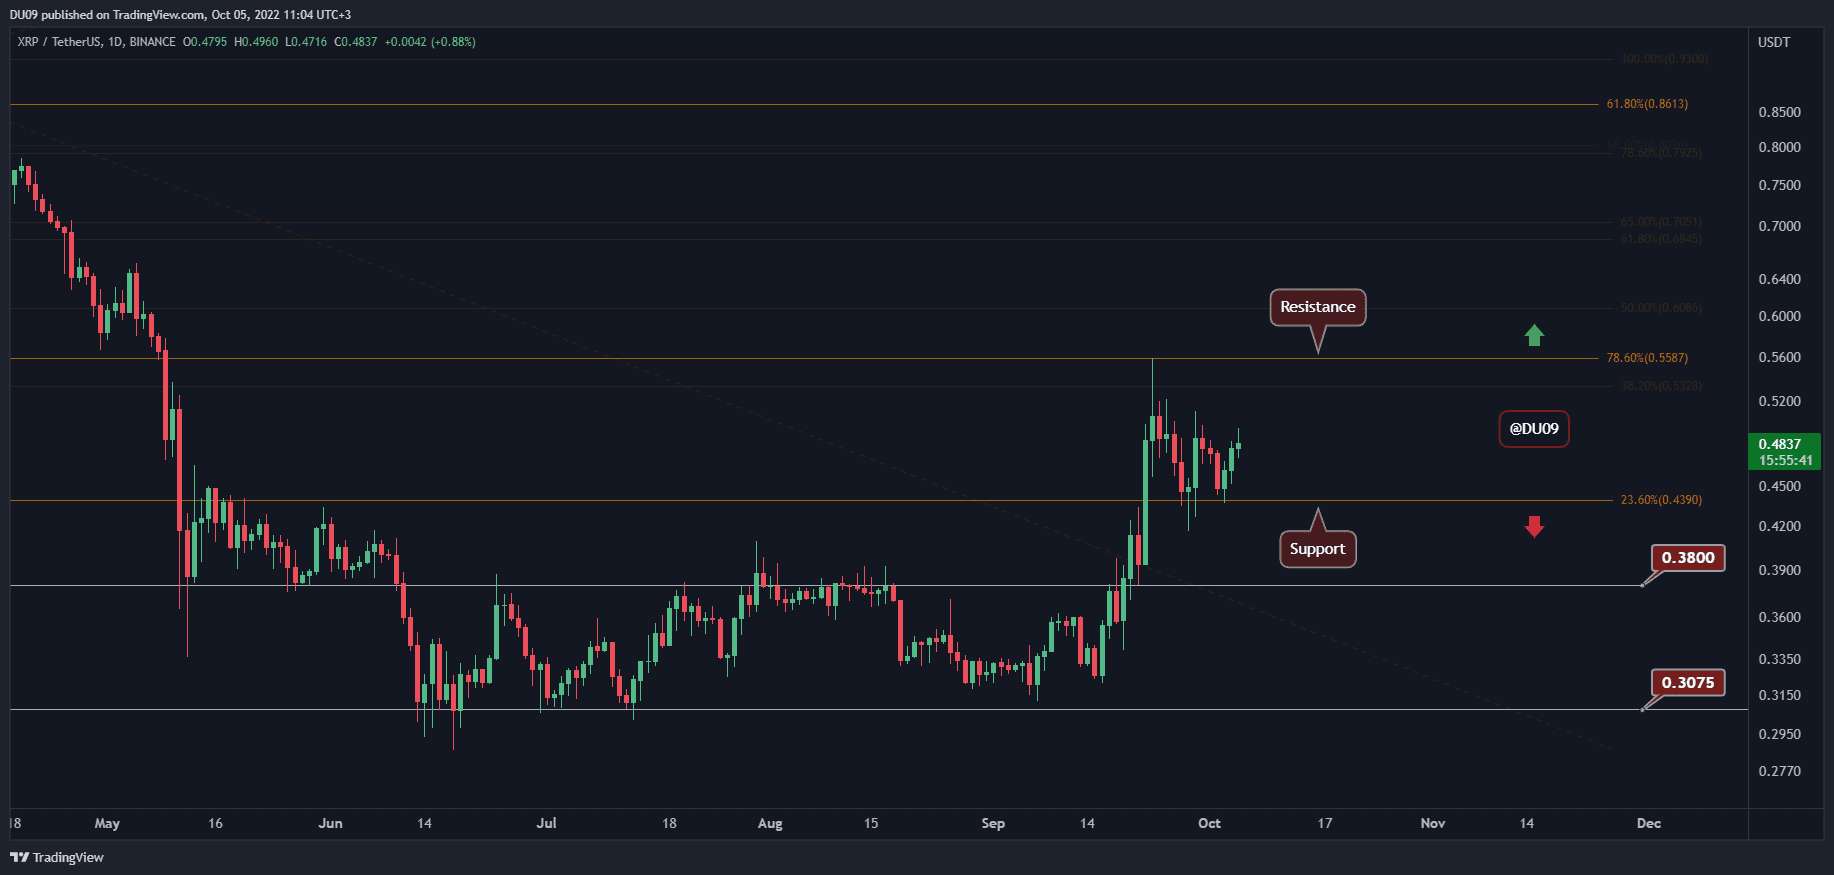
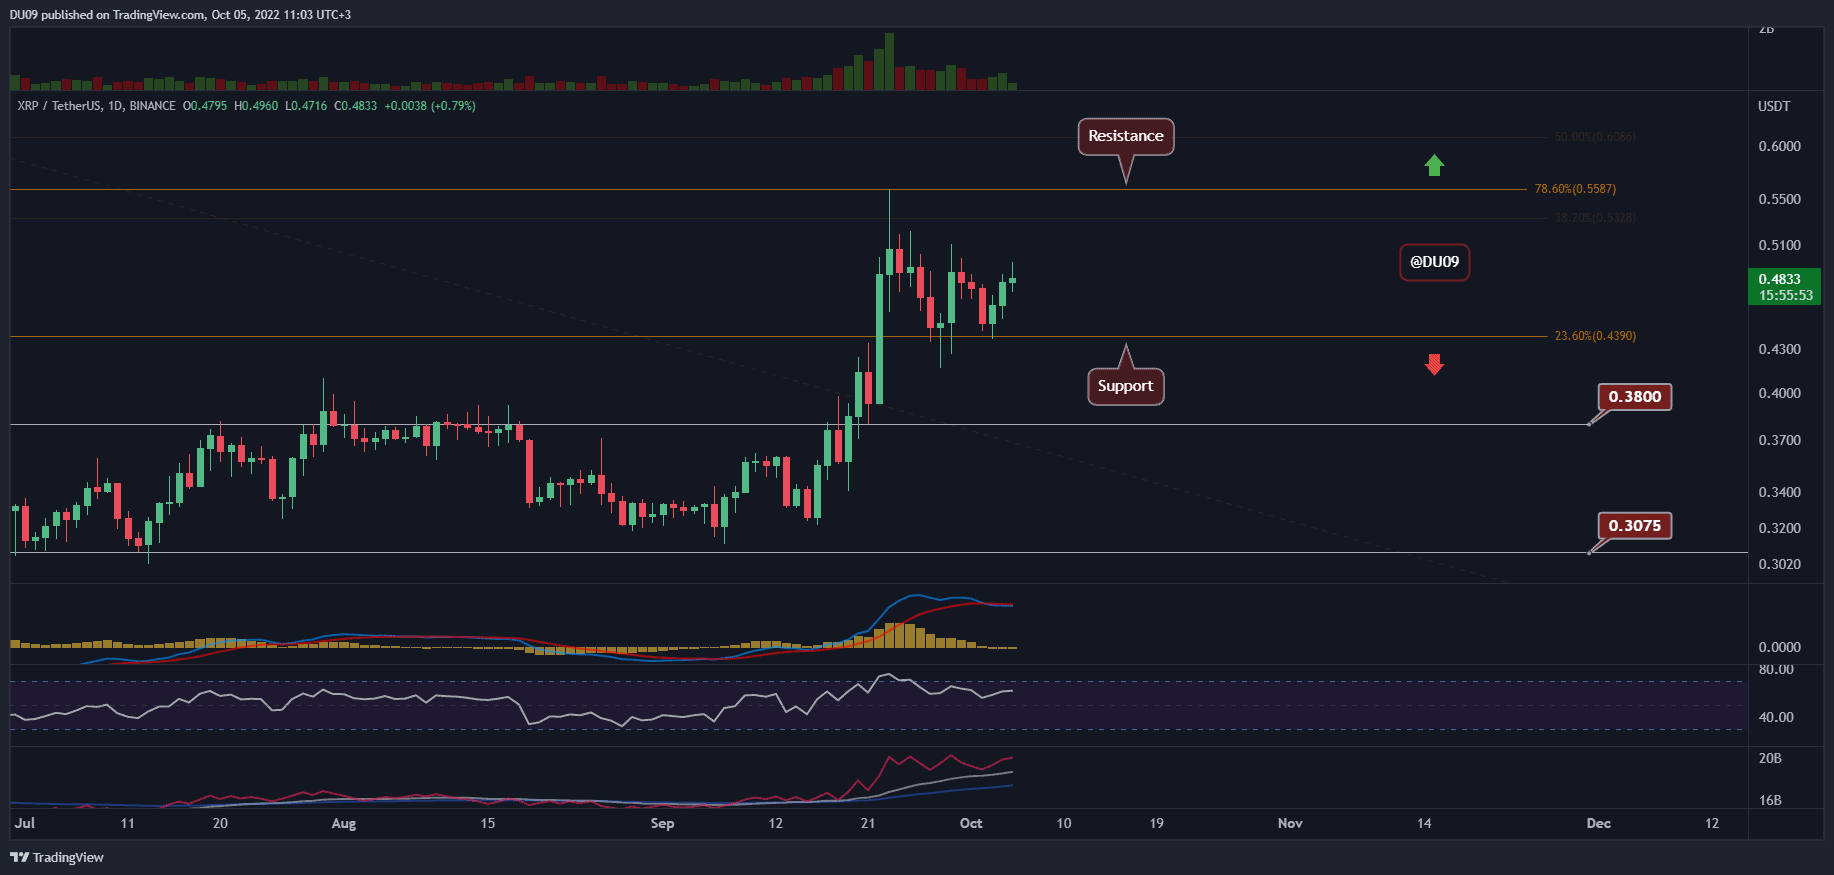
After a second successful test of the key support at $0.44, XRP appears ready to go higher and challenge the key resistance at $0.55. As long as the bulls are in control of the price action, the momentum favors continuation. However, it’s important to keep an eye on the price if it reaches this key level in case the bears step in as they did back on September 23rd.

Technical Indicators
Trading Volume: The volume has remained bullish, and the last three daily candles are in the green – at the time of this post. While the volume decreased since the spike on September 23rd, buyers remain interested in XRP.
RSI: The daily RSI has managed to hold above 50 points and now appears keen to curve back up towards the overbought area at 70 points.
MACD: The daily MACD is flat despite a bearish cross a few days ago. This signals that bulls may renew their efforts against the key resistance soon.

Bias
The bias for XRP is bullish.
Short-Term Prediction for XRP Price
The price action shows that buyers are still committed to taking XRP above $0.50 and even above the key resistance at $0.55. Should they be successful, this would open the way for the cryptocurrency to aim for $0.70 next.
The post XRP Eyes $0.50 Following 5% Daily Surge (Ripple Price Analysis) appeared first on CryptoPotato.


