XRP Eyes $0.30 Following 2-Week Sideway Action (Ripple Price Analysis)
- XRP climbed by a small 3% this week as it reached the $0.29 level.
- Toward the end of last week, the coin bounced higher from the .382 support at $0.264.
- Against Bitcoin, XRP penetrated above a falling trend line.
XRP/USD – Bulls Bounced from .382 Fib Support
Key Support Levels: $0.28, $0.264, $0.256.
Key Resistance Levels: $0.3, $0.313, $0.321.
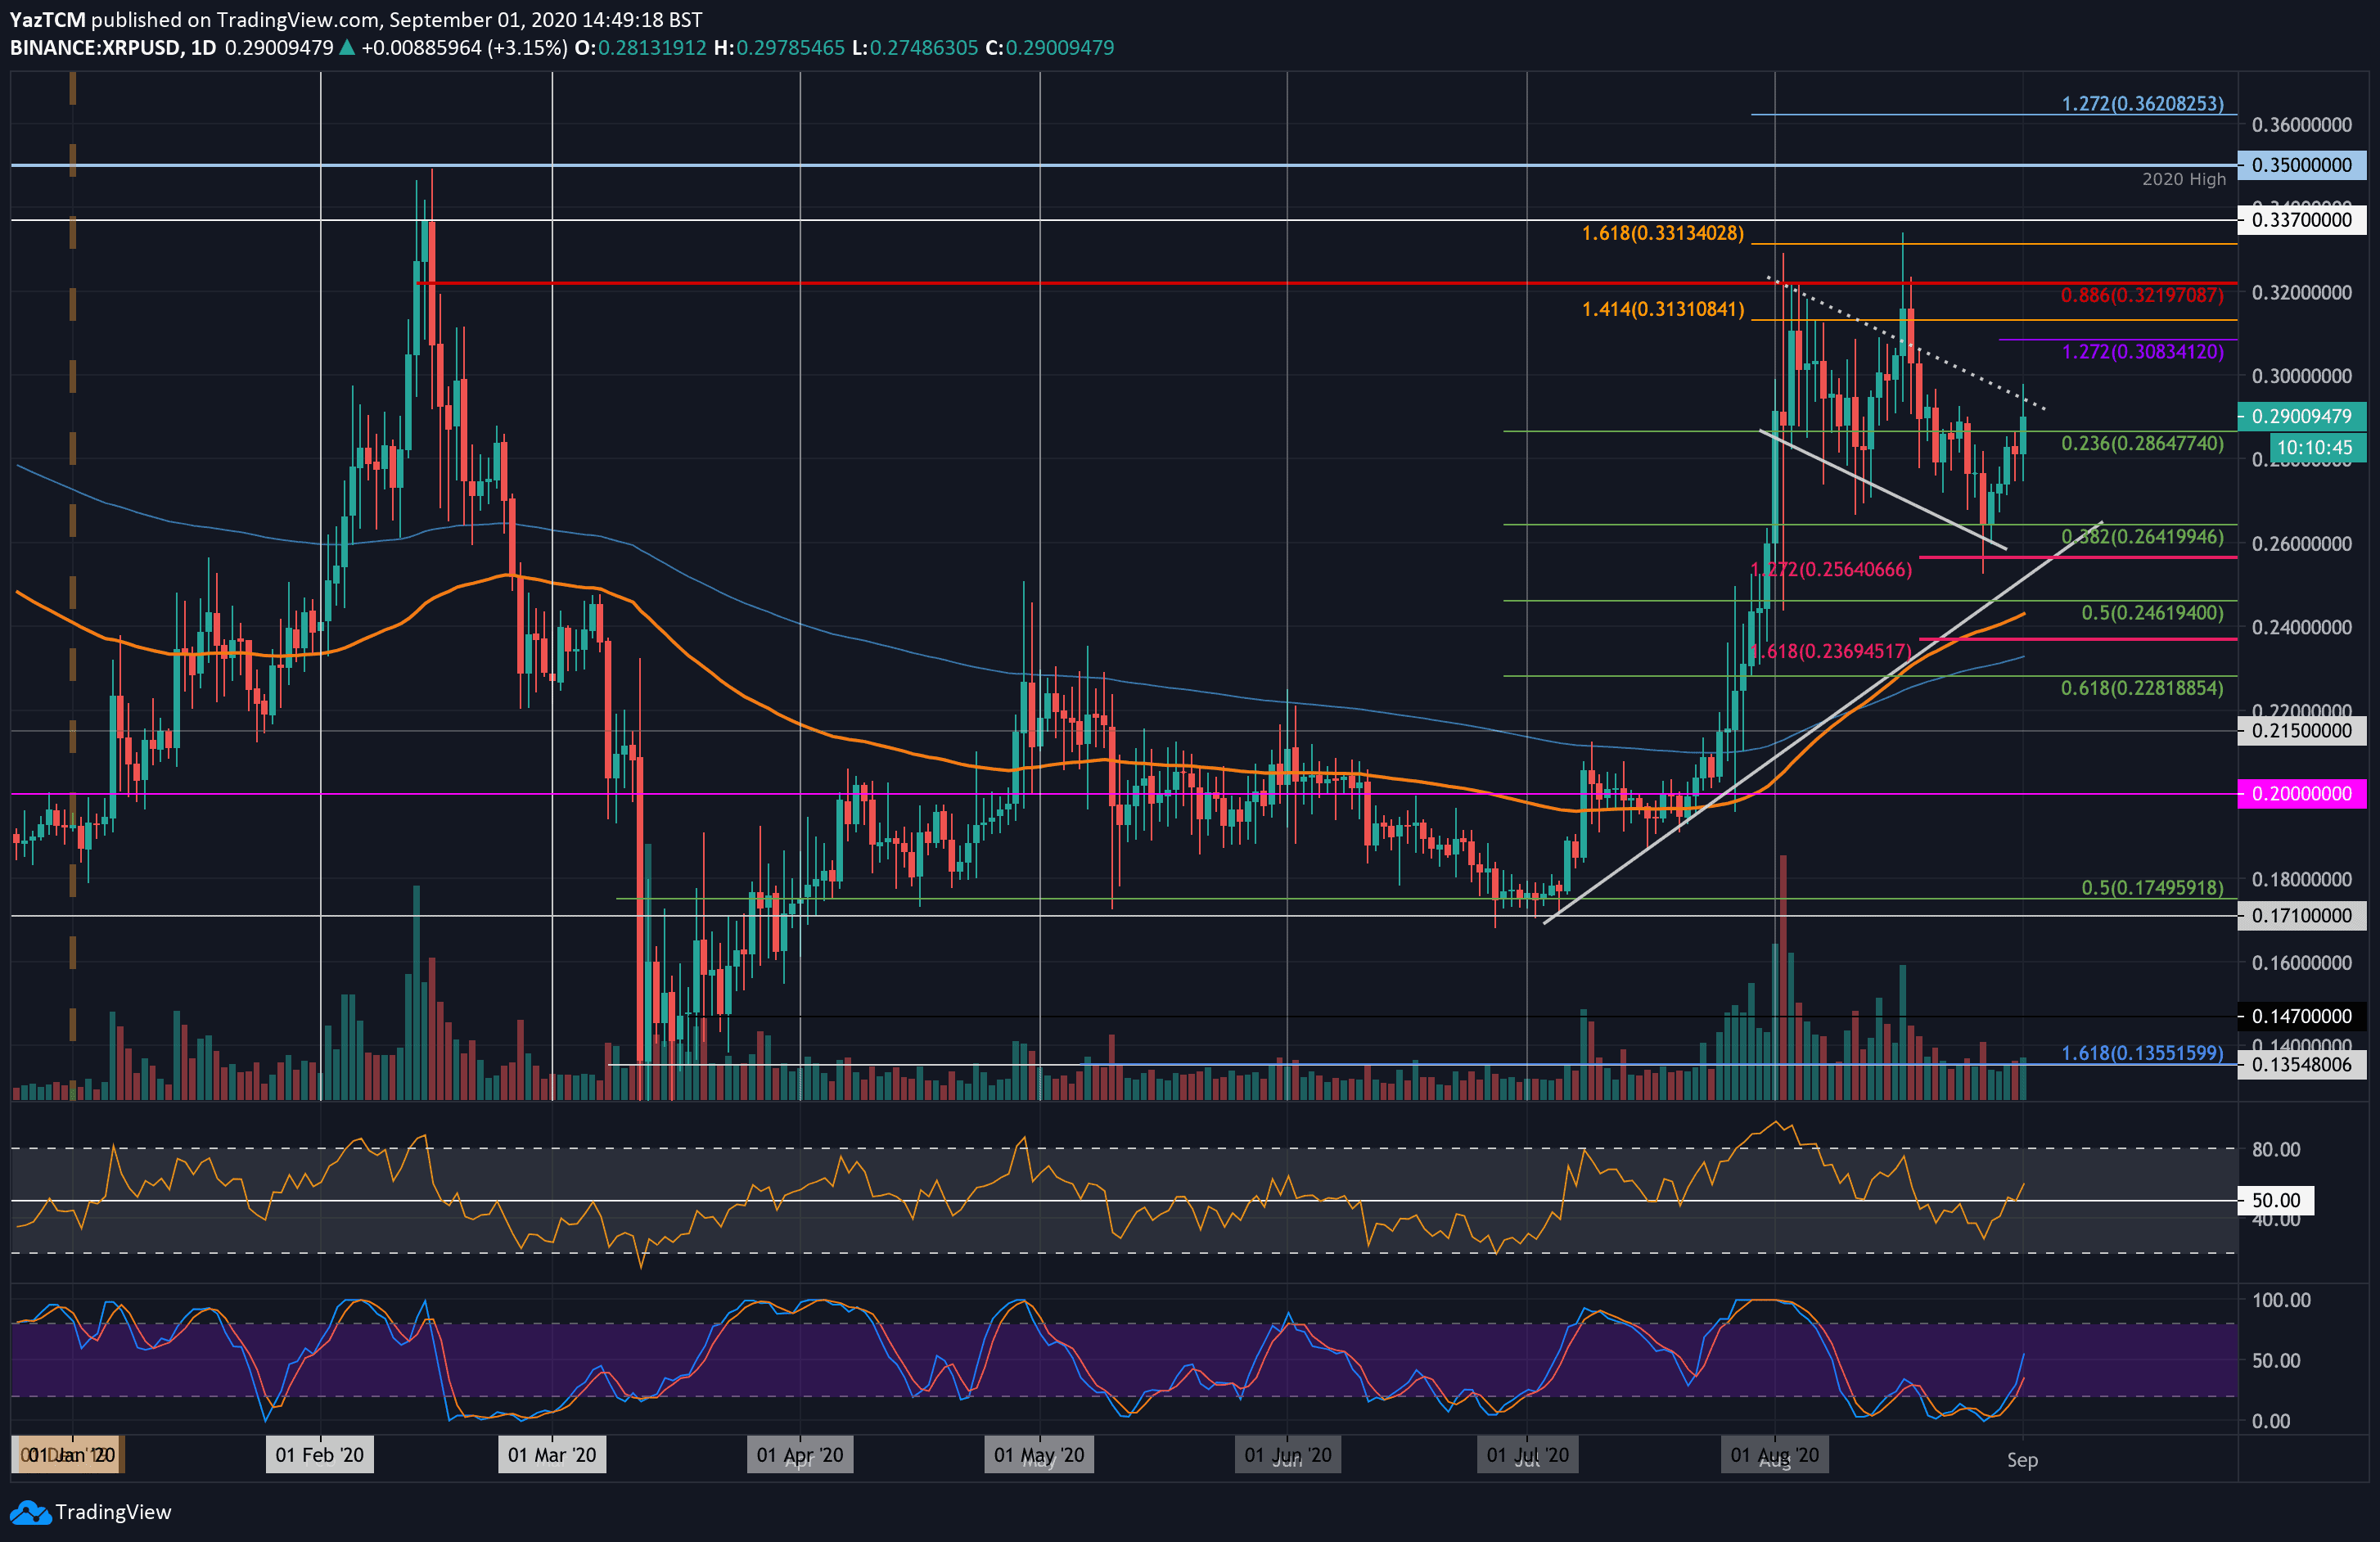
Since the start of August, XRP has mostly been trading within a falling price channel. Over the past fortnight, the coin had dropped beneath $0.3 and continued. Luckily, the bulls defended the support at $0.264 (.382 Fib Retracement), which allowed it to rebound over the weekend.
After bouncing, XRP pushed higher to reach the current $0.29 level as it faces resistance at the upper boundary of the falling price channel.
XRP-USD Short Term Price Prediction
Once the buyers climb above the current channel’s upper boundary, resistance lies at $0.3 and $0.308 (1.272 Fib extension). Above this, resistance is found at $0.313, $0.321 (bearish .886 Fib Retracement) and $0.331 (1.618 Fib Extension).
On the other side, if the sellers push lower, support lies at $0.28, $0.264 (.382 Fib Retracement), and $0.256.
Both the RSI and Stochastic RSI have produced bullish signals with the RSI crossing above the mid-line and the Stochastic RSI producing a bullish crossover signal in oversold conditions.
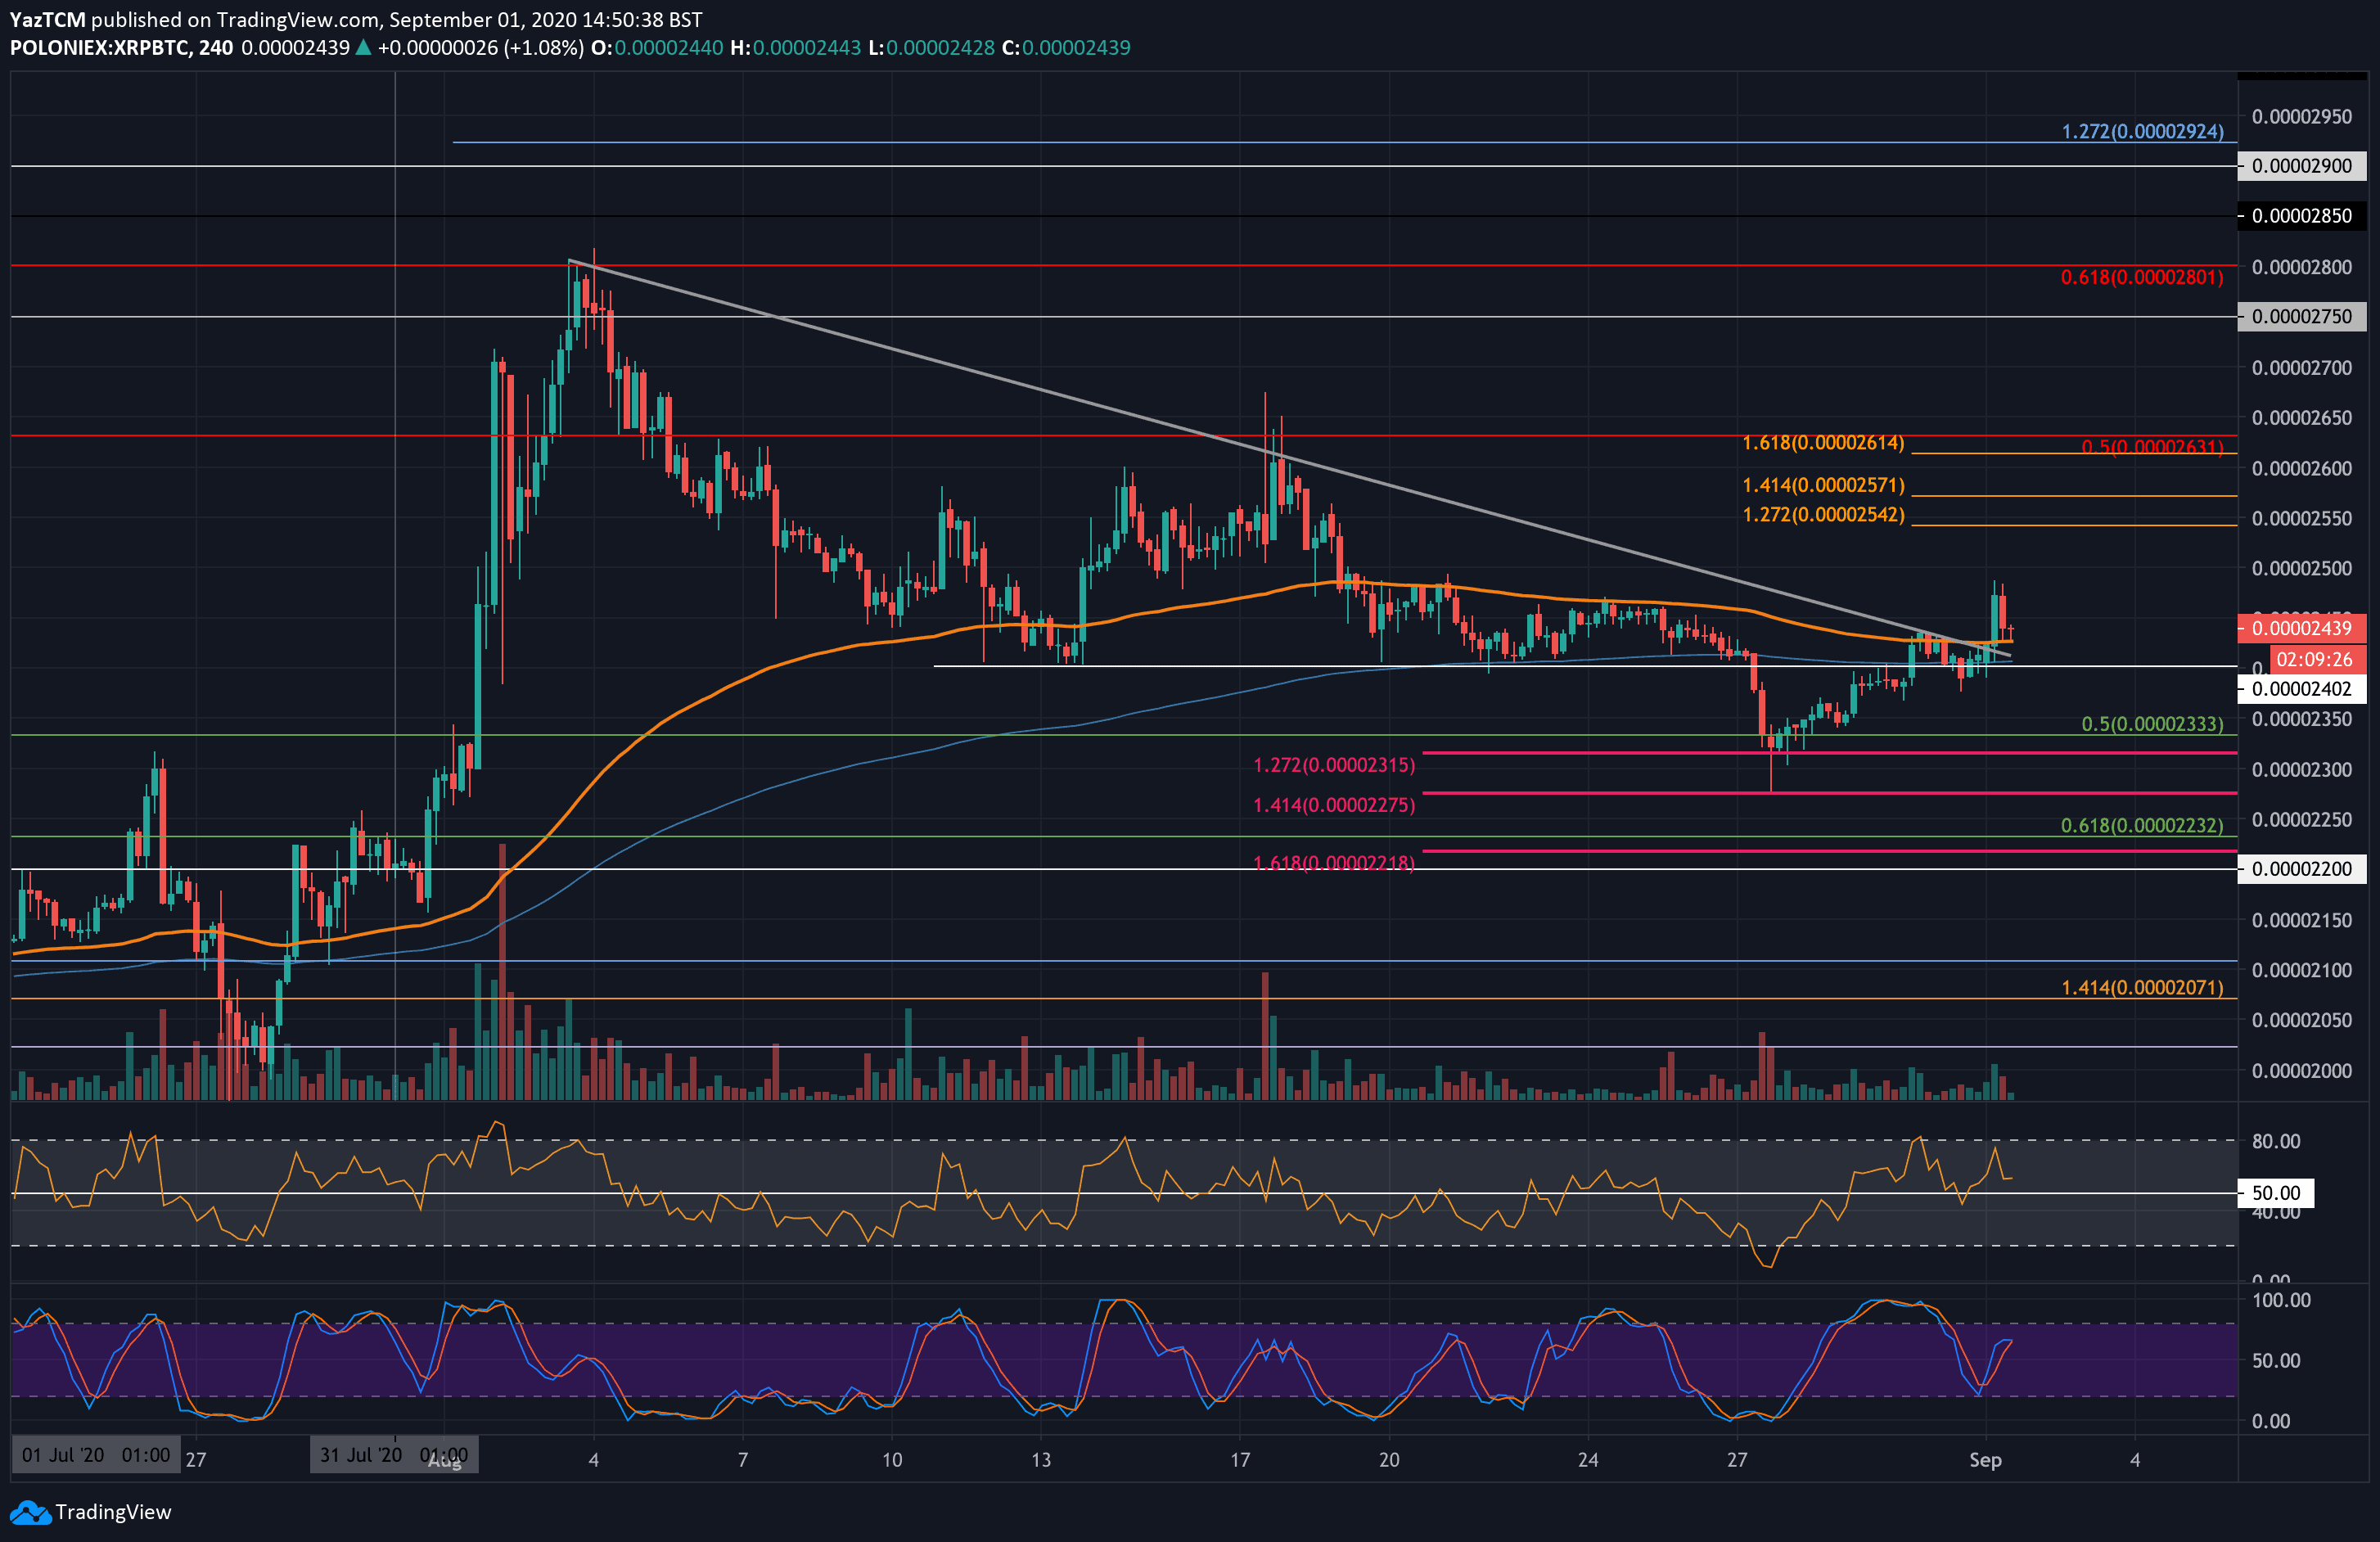
XRP/BTC: XRP Breaks Falling Trend Line
Key Support Levels: 2400 SAT, 2315 SAT, 2275 SAT.
Key Resistance Levels: 2540 SAT, 2630 SAT, 2750 SAT.
XRP fell beneath the base of the descending triangle toward the end of last week, as expected. After that, the bears found reliable support at 2315 SAT (downside 1.272 Fib Extension) and rebounded. It did spike further lower into the 2275 SAT level but quickly recovered.
From there, XRP climbed back into the previous triangle and eventually broke above the falling trend line today. This could be a signal that a new bull run against Bitcoin is imminent.
XRP-BTC Short Term Price Prediction
Looking ahead, if the bulls push higher, the first level of resistance lies at 2540 SAT (1.272 Fib Extension). This is followed by strong resistance at 2630 SAT (bearish .5 Fib Retracement), 2750 SAT, and 2800 SAT (bearish .618 Fib Retracement).
On the other side, the first level of strong support lies at 2400 SAT. This is followed by support at 2315 SAT (downside 1.272 Fib Extension), 2275 SAT (downside 1.414 Fib Extension), and 2230 SAT (.618 Fib Retracement).
The post XRP Eyes $0.30 Following 2-Week Sideway Action (Ripple Price Analysis) appeared first on CryptoPotato.


