XRP Dips Below $0.30 Following Bitcoin’s Latest Dive, What’s Next? (Ripple Price Analysis)
- XRP fell by a total of 4% today as the coin drops back beneath $0.3 to reach $0.293.
- At the start of this week, XRP attempted to push higher as it spiked to $0.331.
- Against Bitcoin, XRP returned to the 200-days EMA at 2470 SAT today.
XRP/USD: XRP Breaks Beneath $0.30 Once Again
Key Support Levels: $0.286, $0.264, $0.25.
Key Resistance Levels: $0.3, $0.313, $0.321.
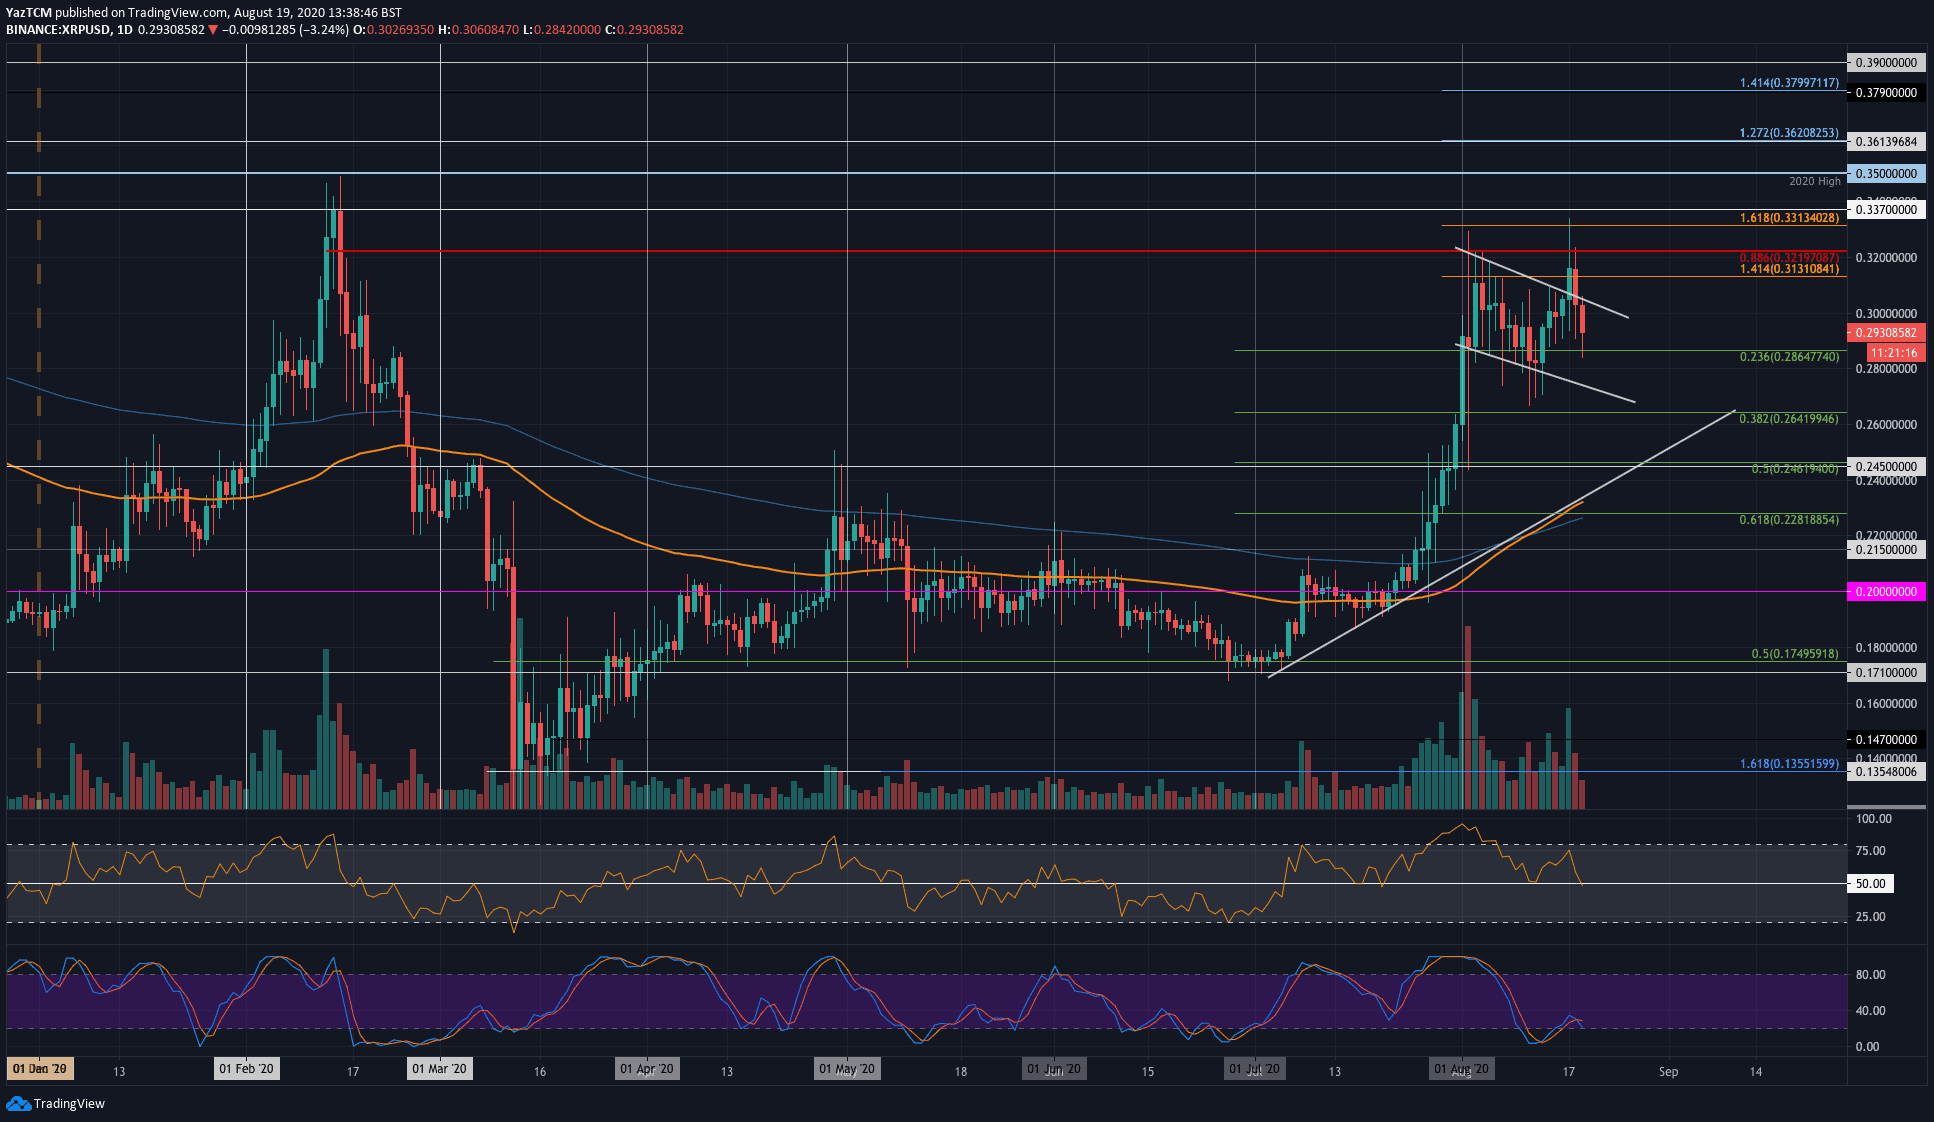
XRP managed to push above $0.3 on Monday as the coin penetrated a short-term falling price channel. The cryptocurrency reached as high as $0.331 before it started to head lower. Yesterday, XRP fell from $0.313 as it dropped back into the previous short-term declining channel.
This decline continued today as XRP penetrated back beneath $0.30 and reached the support at $0.285 (.236 Fib Retracement). It has since rebounded slightly to trade at $0.293. The coin has been bouncing above and below $0.3 for the entire period of August 2020, and a clean daily candle close above $0.321 could allow the bull run to continue.

XRP-USD Short Term Price Prediction
If the sellers push XRP lower, the first level of support lies at $0.286 (.236 Fib retracement). If the bears continue beneath $0.28, support is located at the lower boundary of the price channel, $0.264 (.382 Fib Retracement), and $0.245 (.5 Fib Retracement).
On the other side, if the bulls can regroup and push higher, the first level of resistance lies at $0.3. Following this, additional resistance is located at $0.313 (1.414 Fib Extension), $0.321 (bearish .886 Fib Retracement), and $0.331 (1.618 Fib Extension).
The RSI poked beneath the mid-line today, suggesting that the sellers are ready to take control of the market momentum.
XRP/BTC: XRP Returns To 200-Days EMA
Key Support Levels: 2400 SAT, 2333 SAT, 2232 SAT.
Key Resistance Levels: 2560 SAT, 2630 SAT, 2700 SAT.
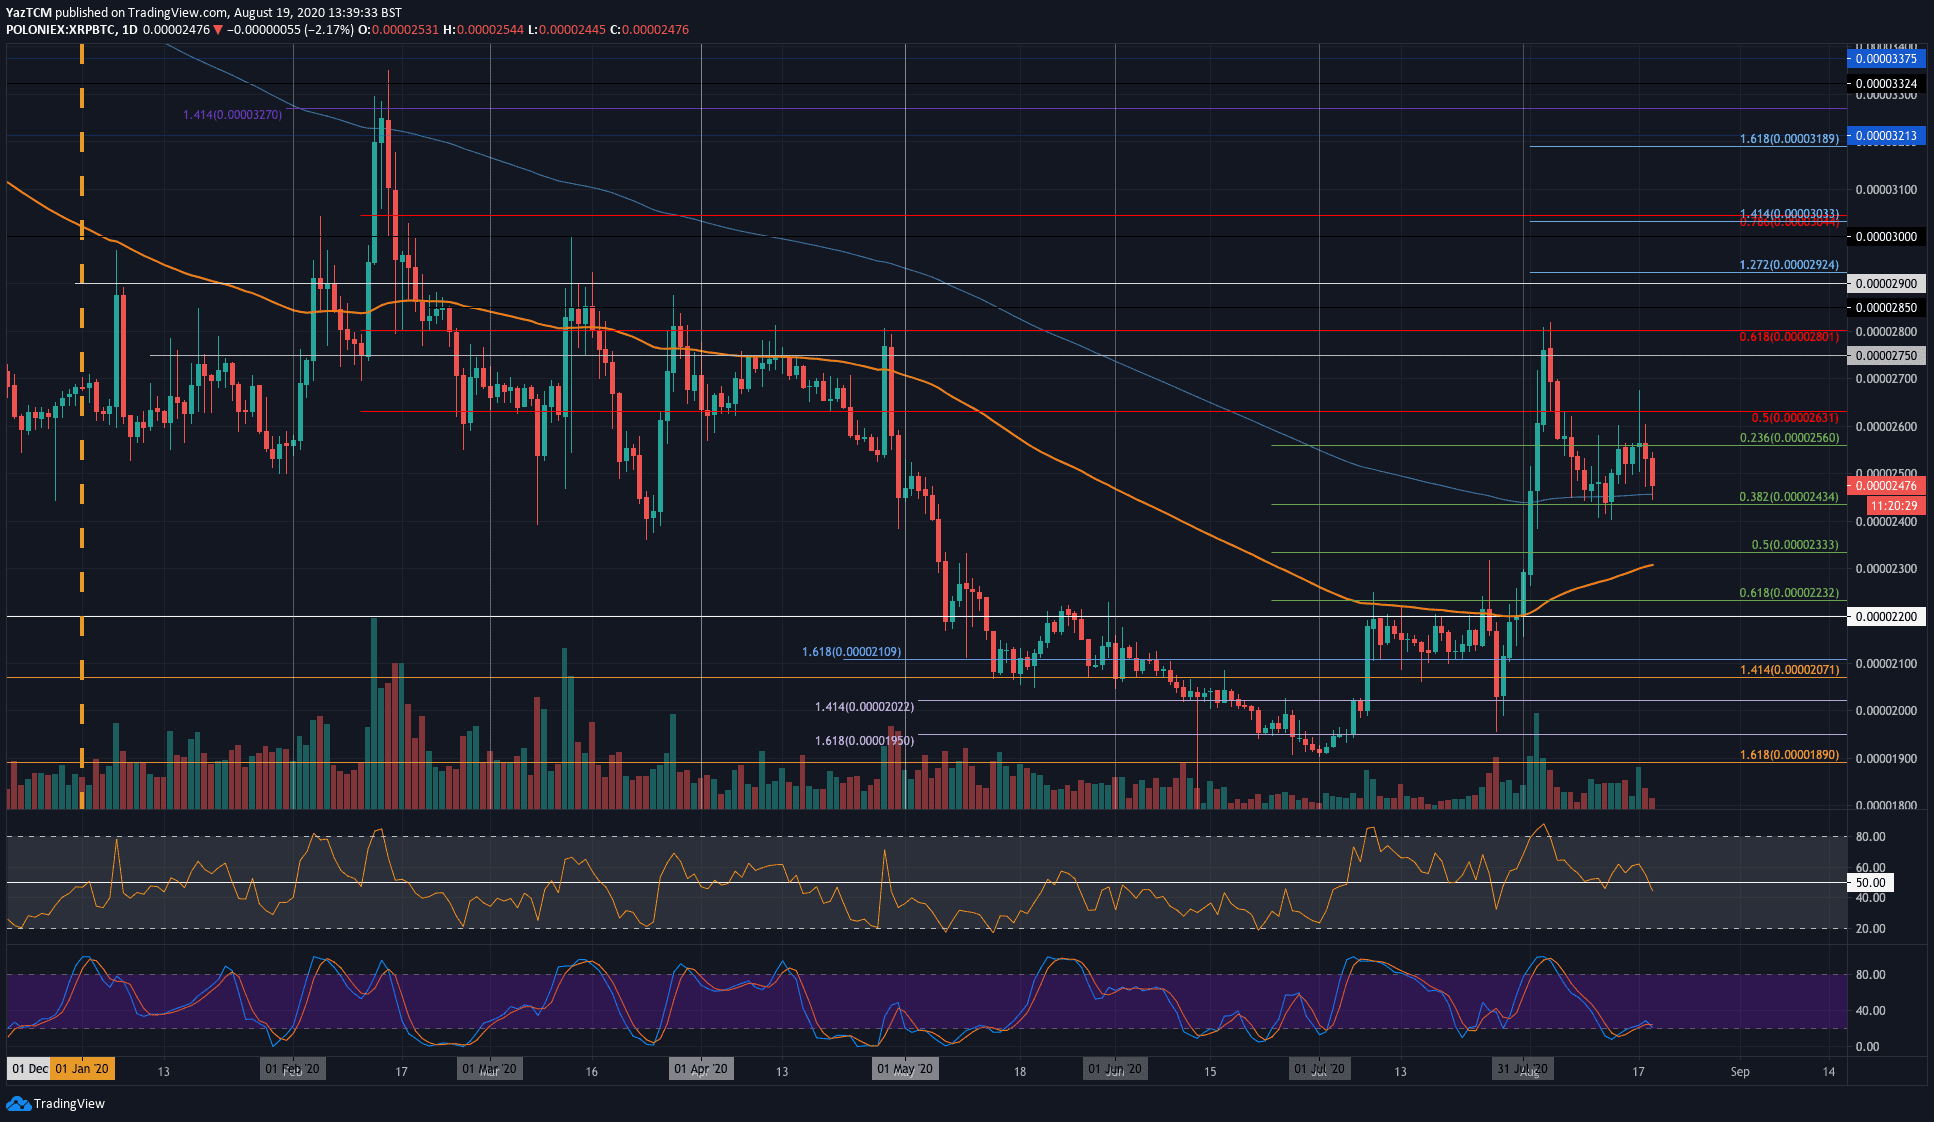
Against Bitcoin, XRP attempted to push above 2560 SAT at the start of the week. It did manage to spike as high as 2700 SAT but was unable to close the daily candle above 2560 SAT. Over the past couple of days, XRP fell lower from the 2560 SAT level as it dropped back into the 200-days EMA support at 2460 SAT.
XRP broke the 200-days EMA at the start of August, and this was the first time it remained above the level for more than a day since February 2019. If XRP was to break back beneath the 200-days EMA again, it could kick off another extended downtrend.

XRP-BTC Short Term Price Prediction
Moving forward, if the sellers push beneath the 200-days EMA level, the first level of support lies at 2400 SAT. Beneath this, support lies at 2333 SAT (.5 Fib Retracement & 100-days EMA), 2232 SAT (.618 Fib Retracement), and 2100 SAT.
On the other side, the first level of resistance lies at 2560 SAT. Following this, resistance is found at 2630 SAT (bearish .5 Fib Retracement) and 2700 SAT.
Likewise, the RSI has dipped beneath the mid-line to indicate that the bears are now in control of the market momentum, a worrying sign for any bulls.
The post XRP Dips Below $0.30 Following Bitcoin’s Latest Dive, What’s Next? (Ripple Price Analysis) appeared first on CryptoPotato.


