XRP Bull Run Paused as Bears Push Toward $0.6 (Ripple Price Analysis)
Ripple’s price has failed to keep its upward momentum and is currently on a decline. Still, there are several support levels that might push the price higher again.
Technical Analysis
By TradingRage
The USDT Paired Chart
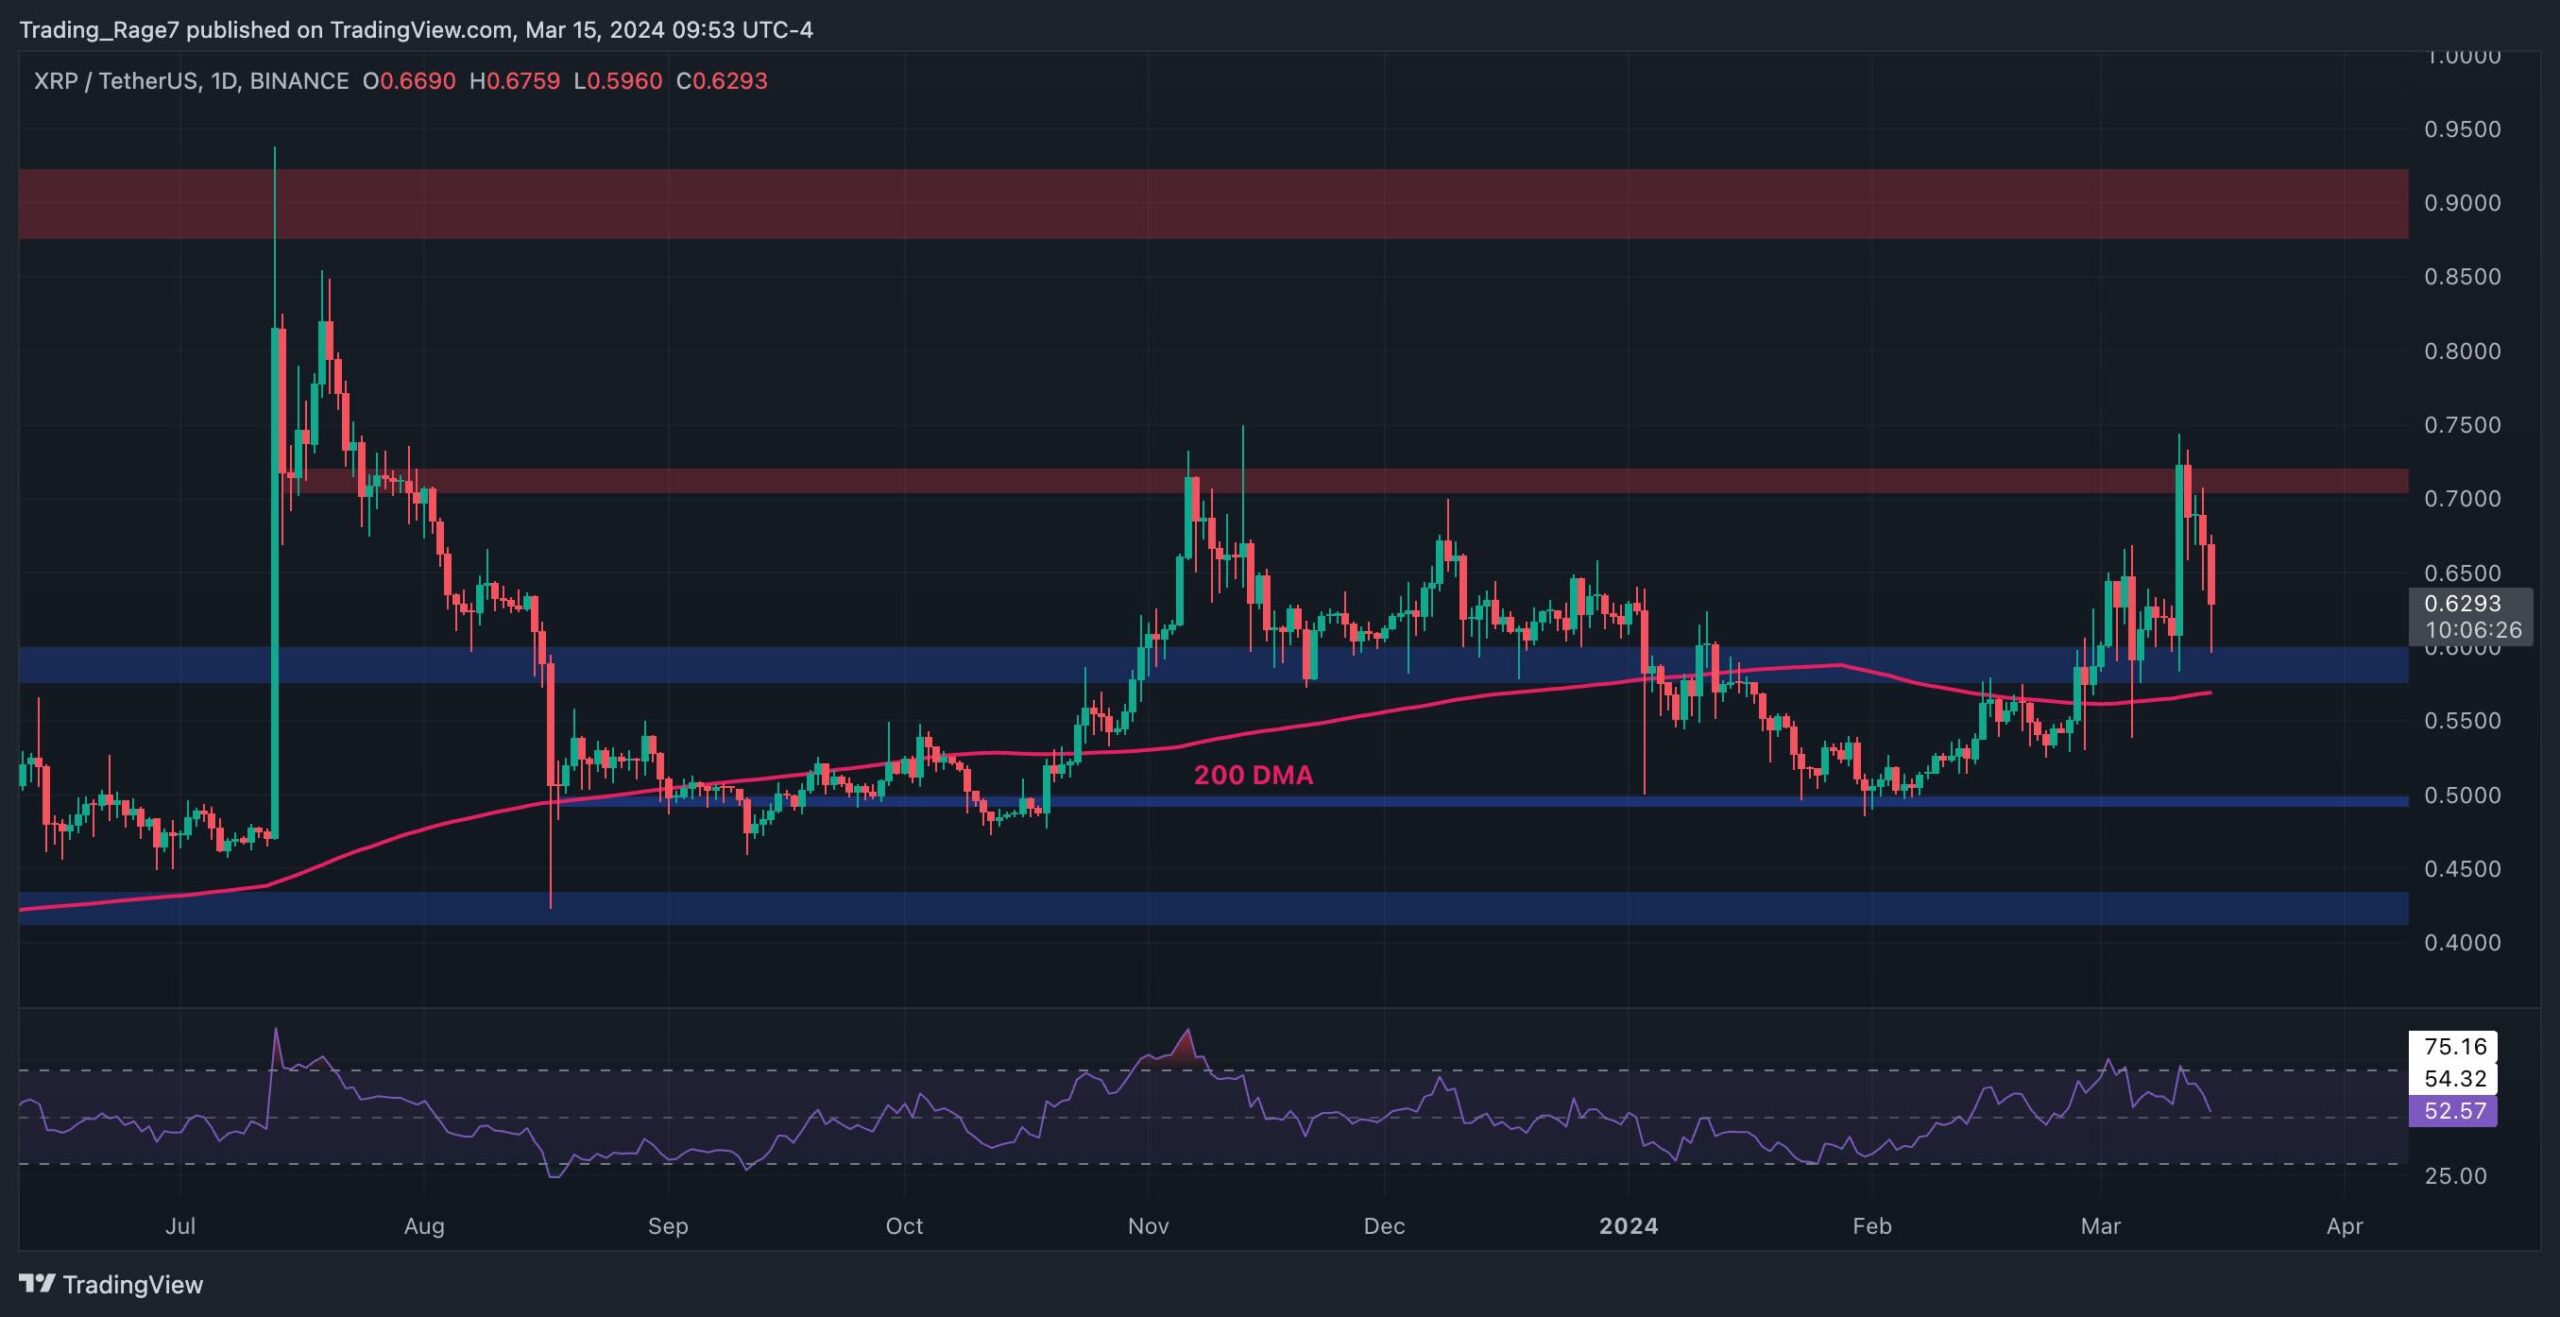
Against USDT, the price has recently made a run at the $0.7 resistance level. Yet, it has been rejected decisively and is currently testing the $0.6 support level once again.
In case this level fails to hold, the 200-day moving average located around the $0.57 mark will be the next critical support. Until Ripple is trading above the 200-day MA, investors can remain optimistic that the market might rally higher.
The BTC Paired Chart
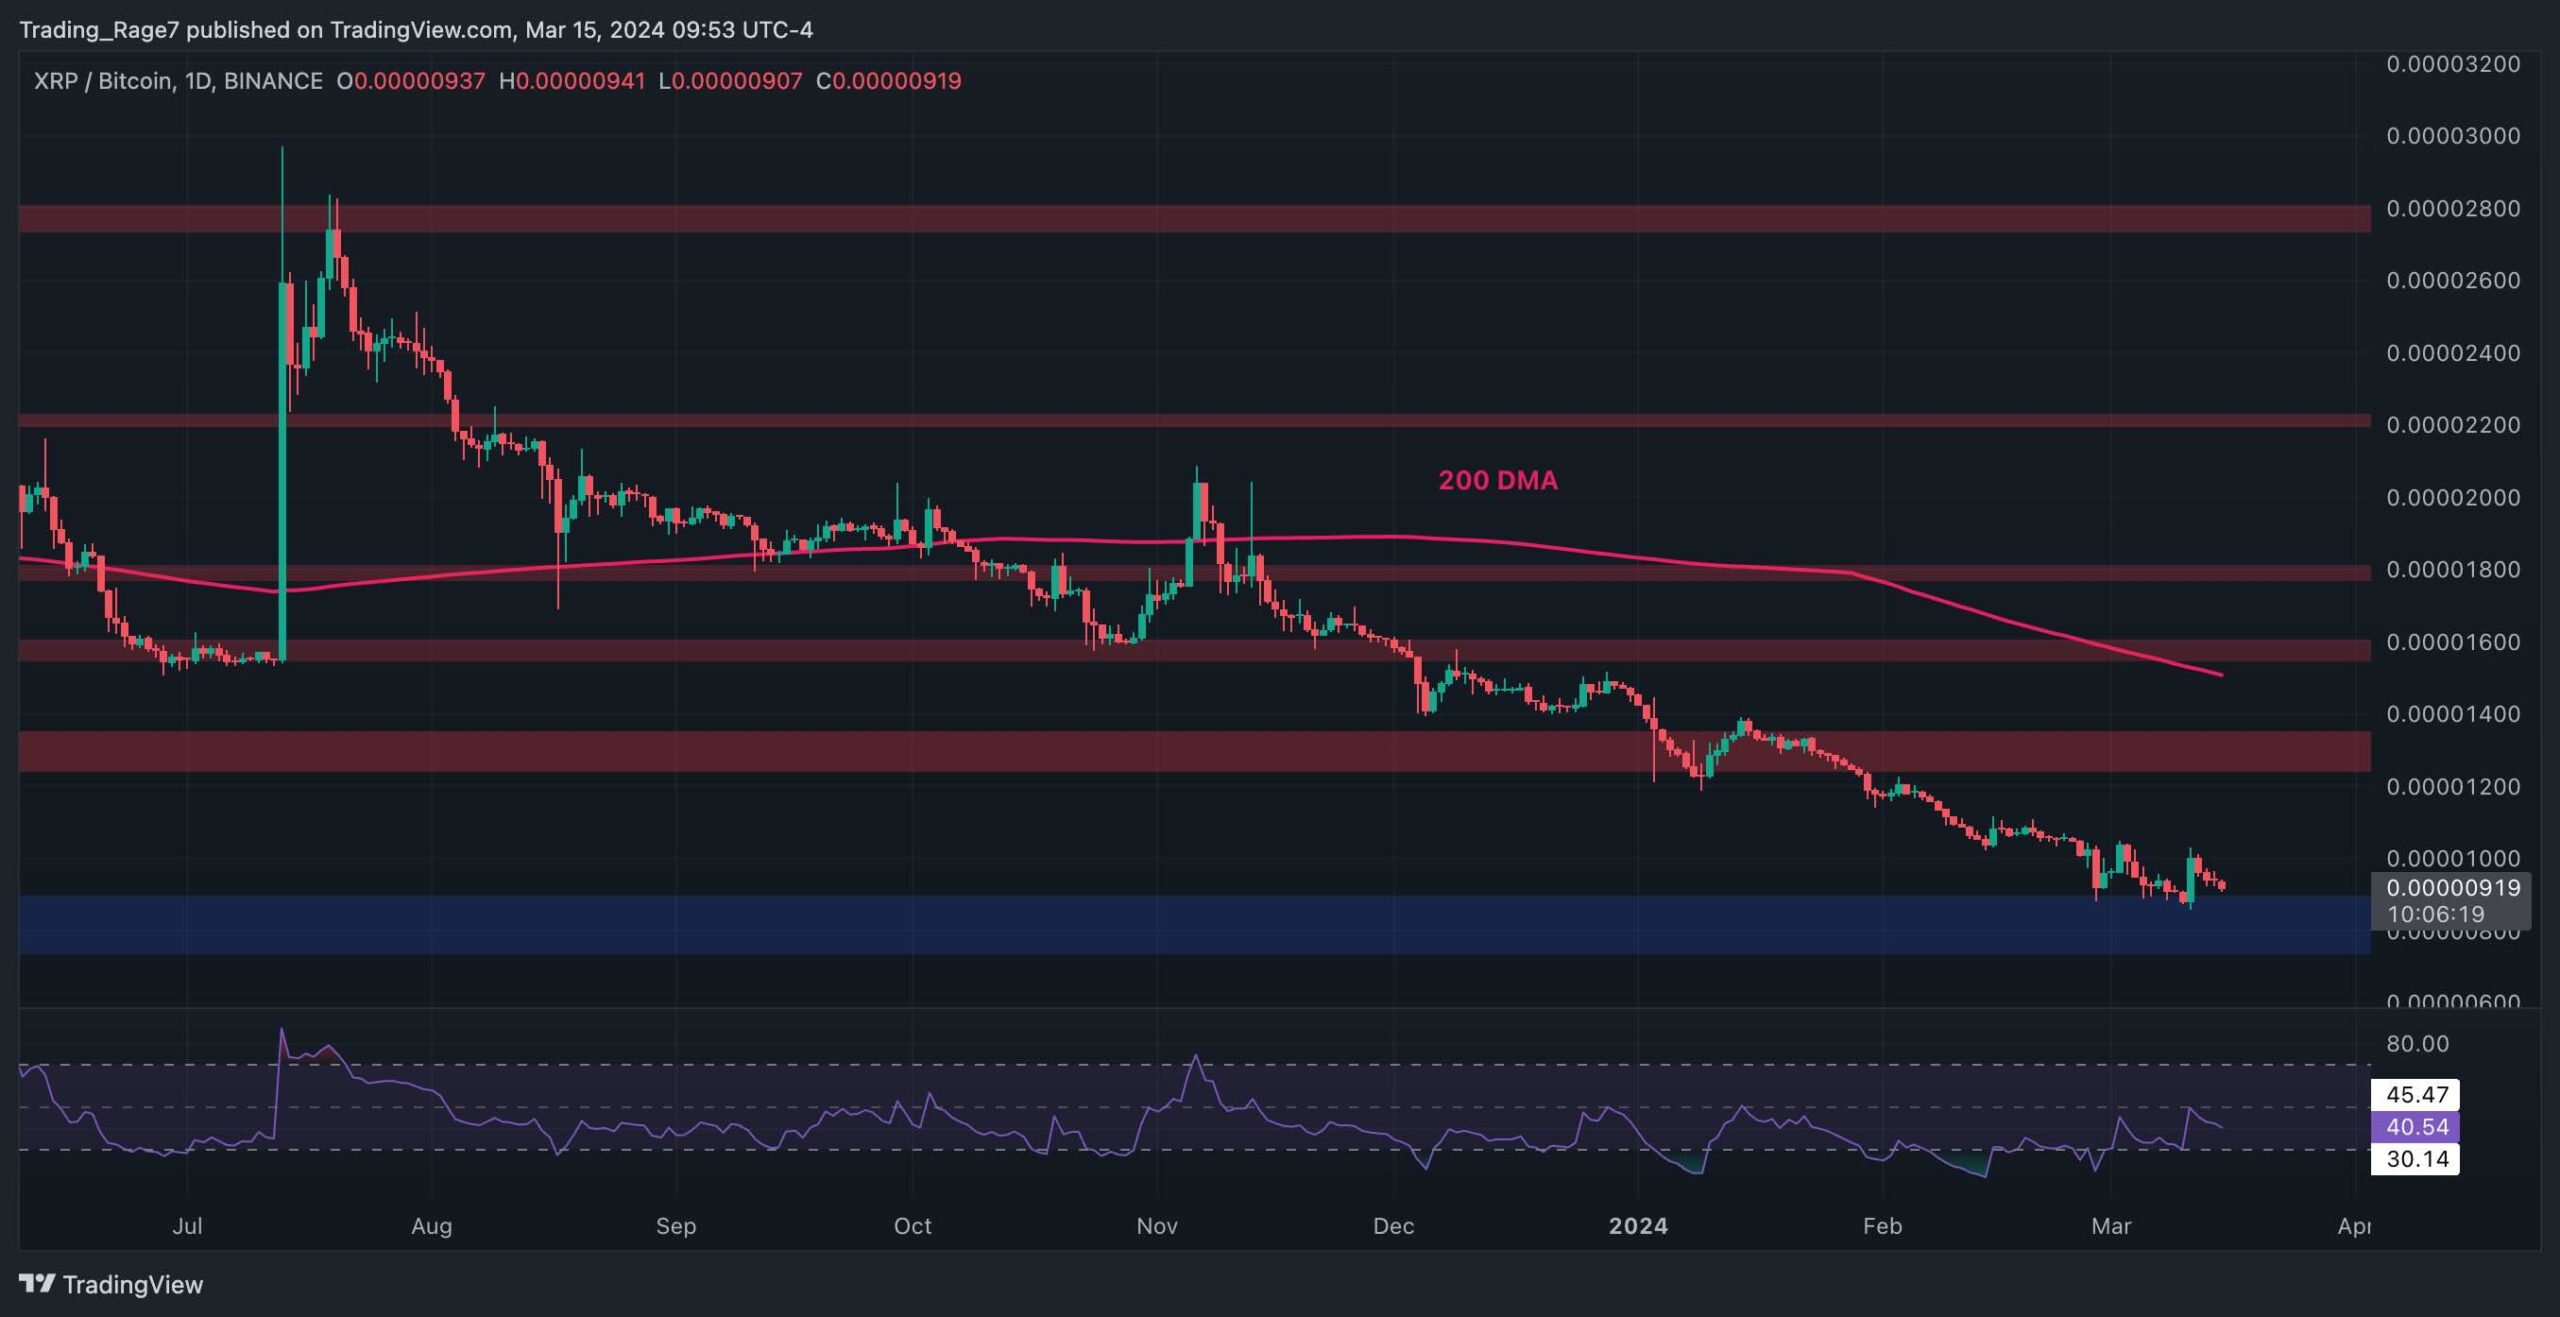
Looking at the Bitcoin pair, things look much worse for XRP. The price has been dropping consistently over the last nine months and is yet to make a bottom.
However, the 800 SAT support zone is currently preventing the cryptocurrency from declining further. The Relative Strength Index, however, is still showing values below 50%, indicating that the momentum is still bearish. As a result, it is still too soon to anticipate if the market will finally bottom out or not.
The post XRP Bull Run Paused as Bears Push Toward $0.6 (Ripple Price Analysis) appeared first on CryptoPotato.