Will XRP Explode Above $0.5 or Will The Correction Deepen? (Ripple Price Analysis)
After forming a bearish double-top pattern and undergoing a period of consolidation, Ripple’s price struggled to break below the 100-day moving average. However, it finally declined below the moving average, reaching $0.44. This decline indicates a bearish outlook for Ripple’s short-term prospects.
Technical Analysis
By Shayan
AThe Daily Chart
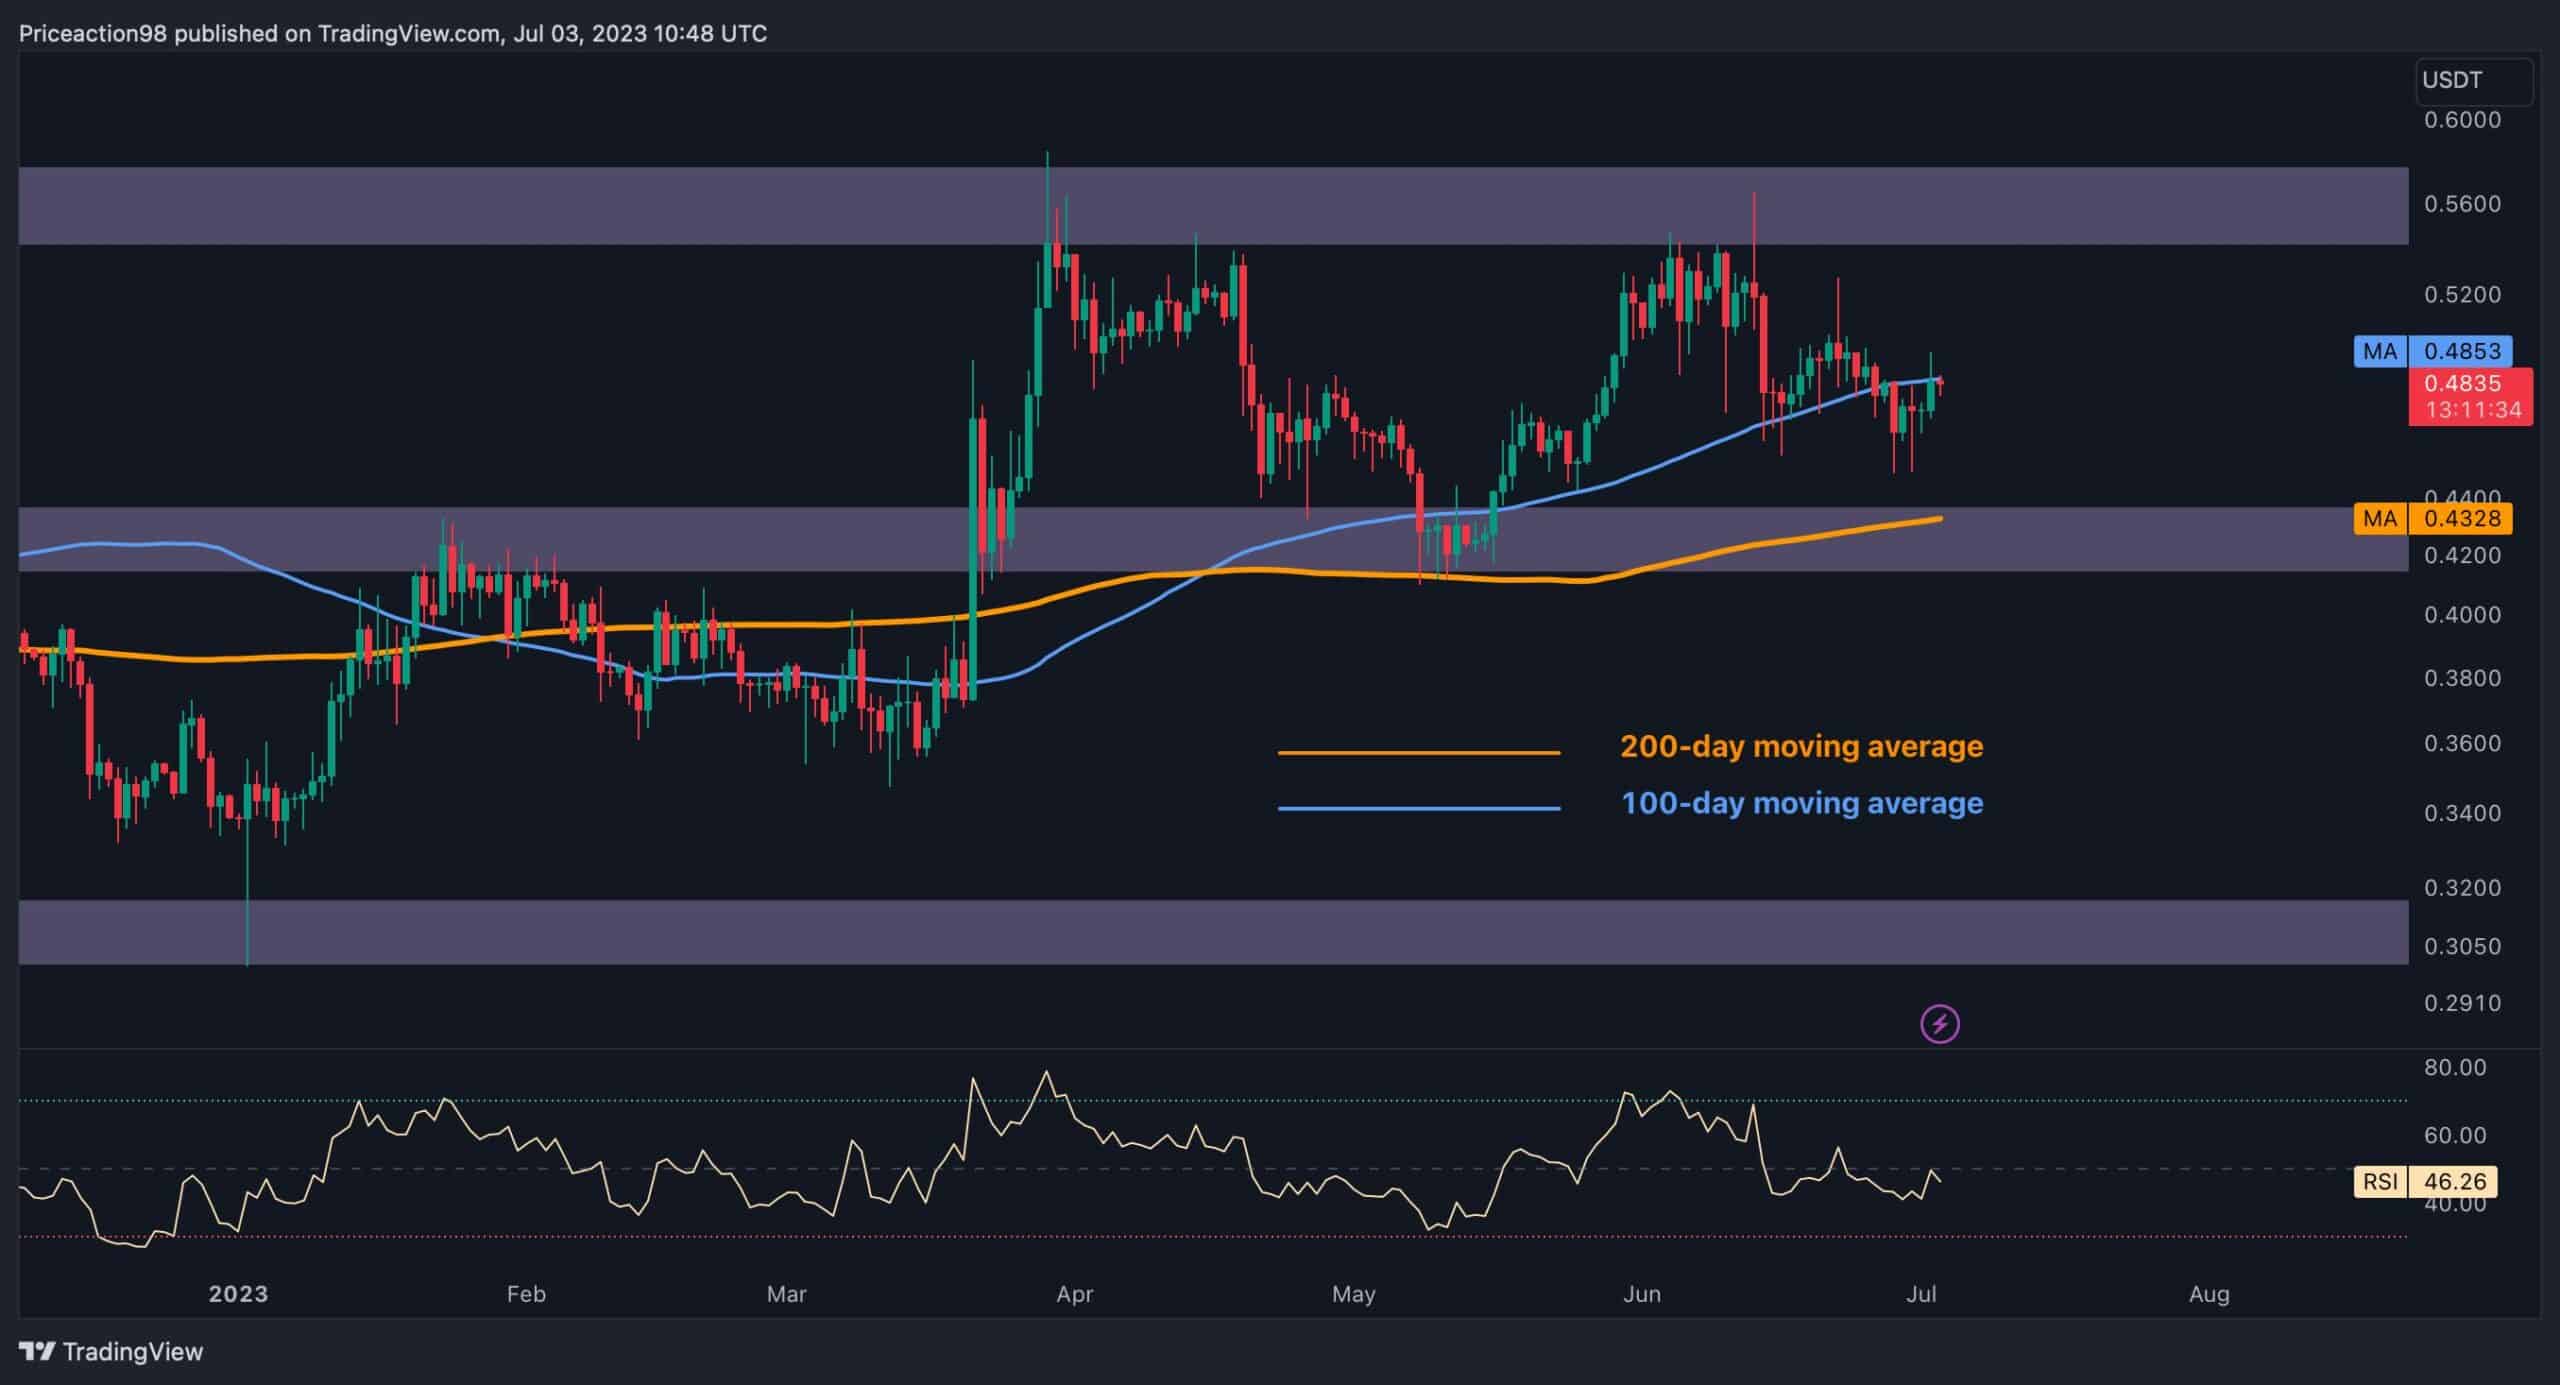
Upon analyzing the Daily Chart, it becomes evident that Ripple’s price exhibited high volatility around the crucial resistance level of $0.5. This resulted in the formation of a bearish double-top reversal pattern. Consequently, there has been a significant decline, breaking below the critical support level represented by the 100-day moving average.
Currently, the price is retracing back to the previously broken level at $0.485, creating a pullback. If it’s successful, another decline toward the next crucial support region can be anticipated. This region encompasses the substantial support of the 200-day moving average at $0.4328, as well as the static support zone at $0.42.
The 4-Hour Chart
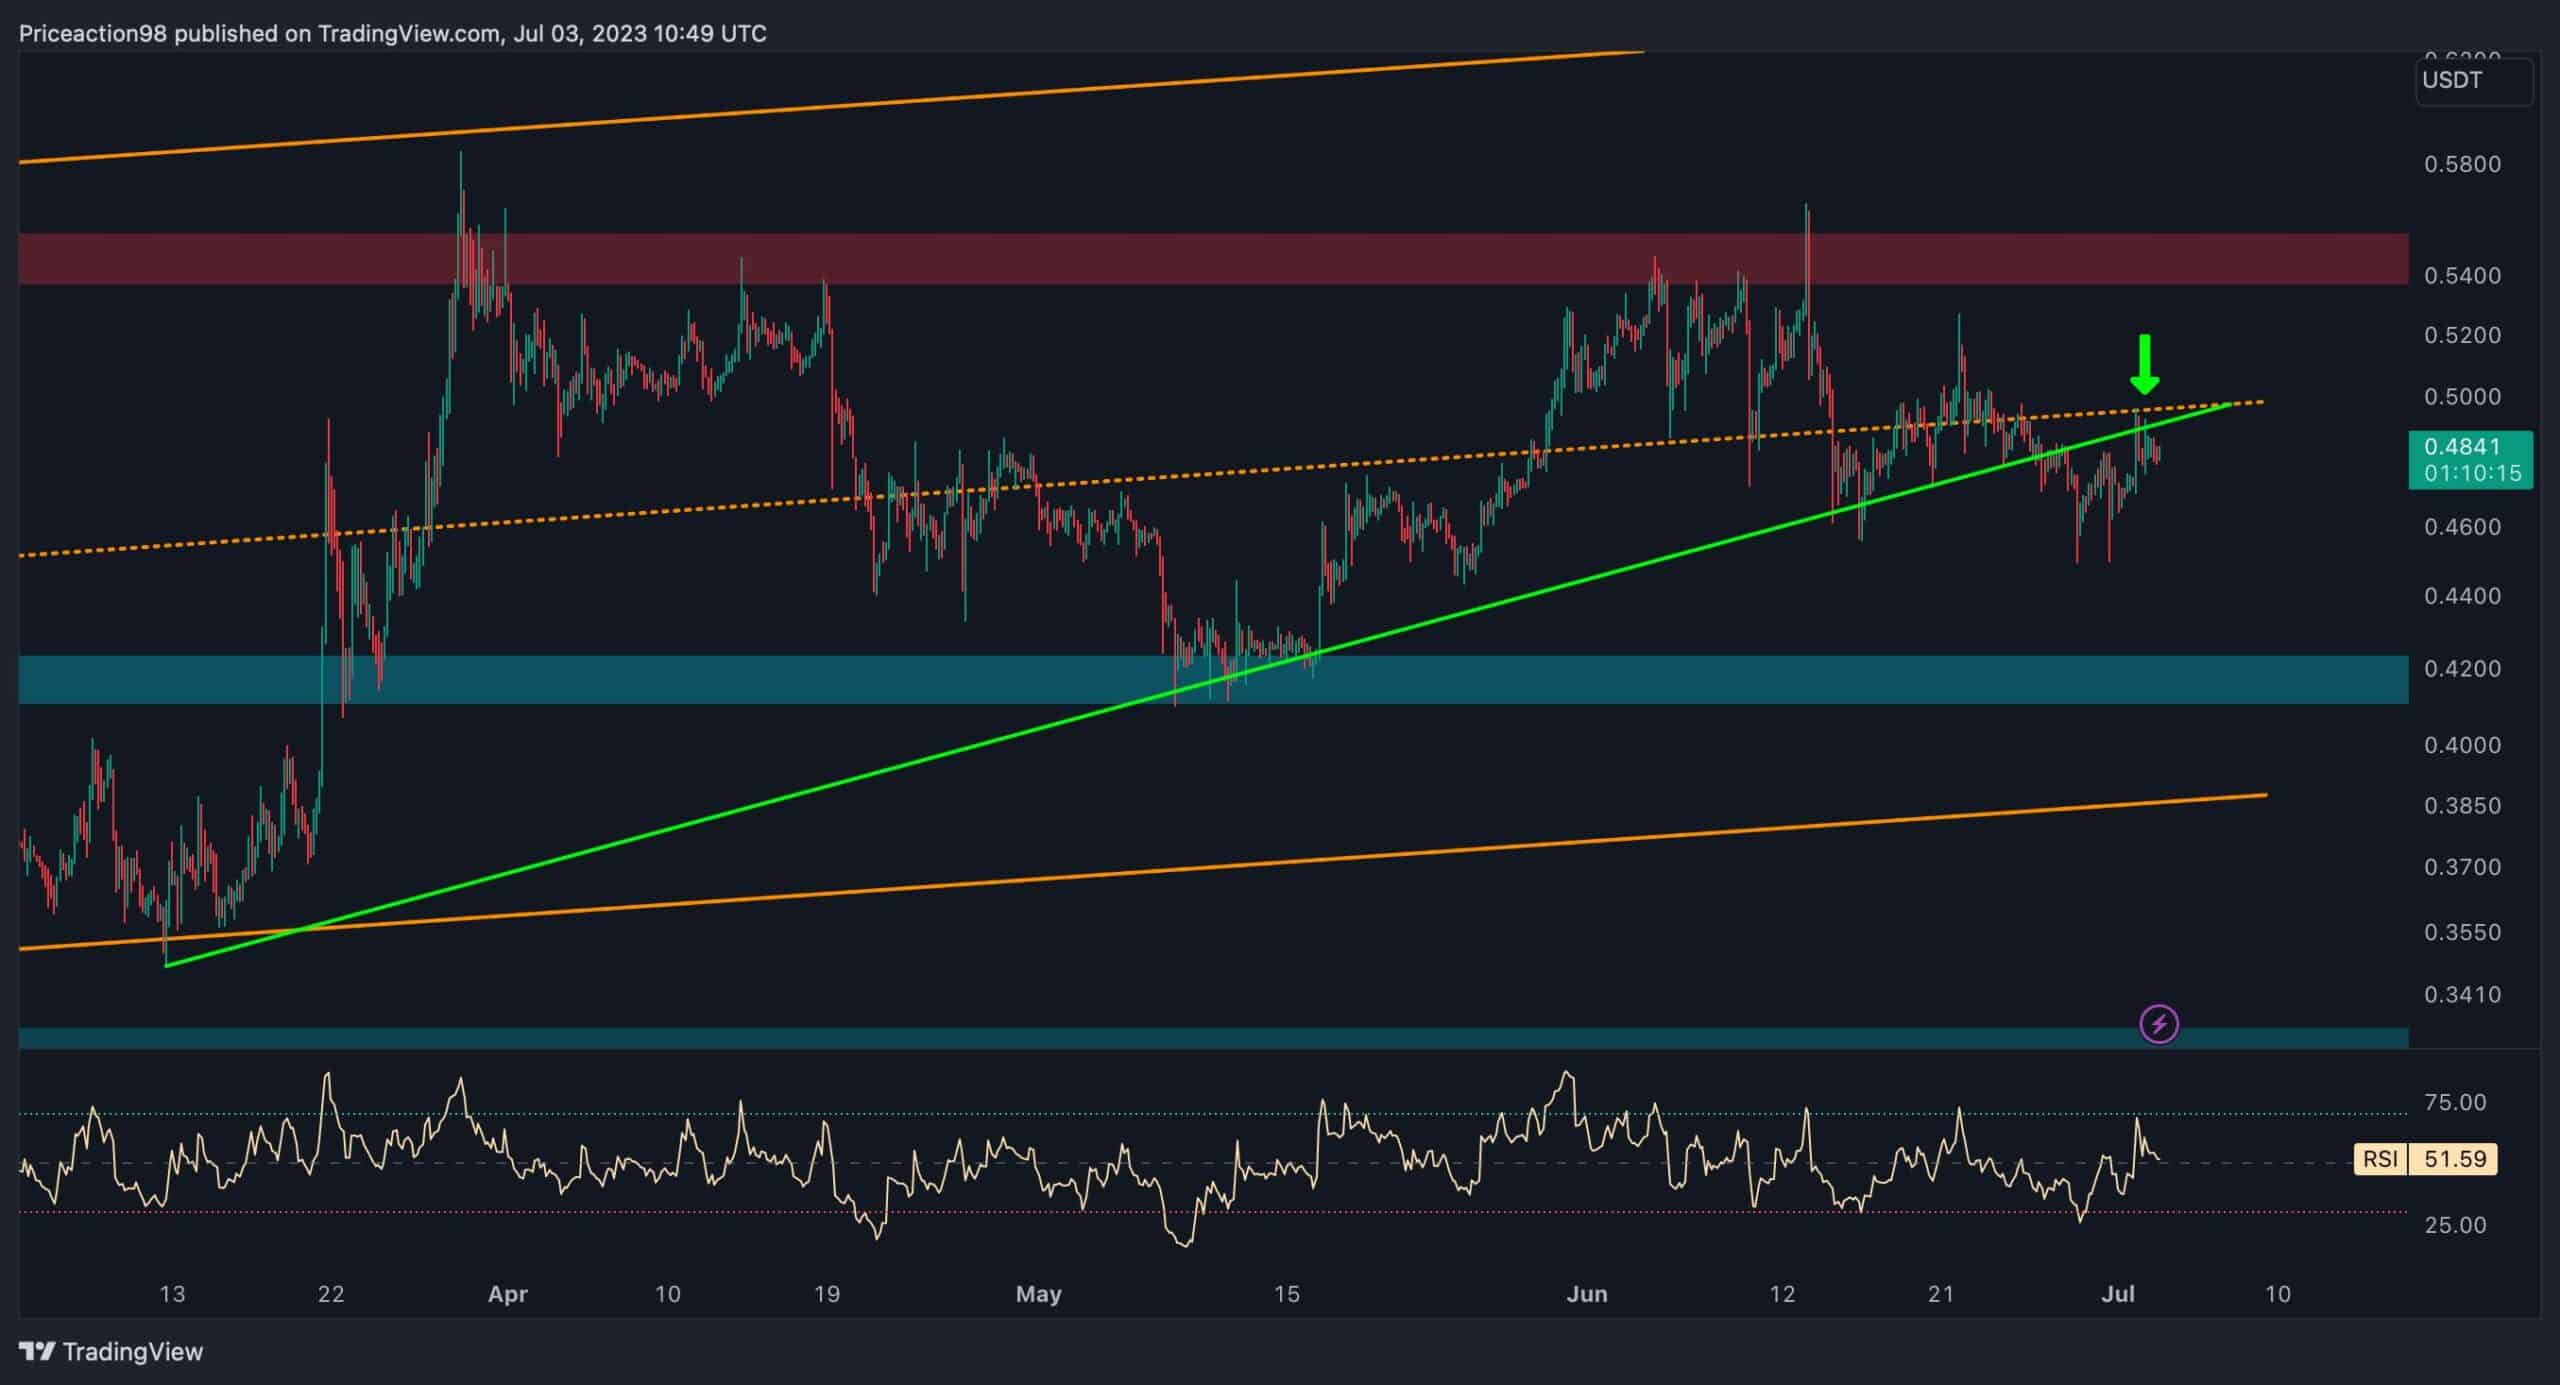
Shifting our attention to the 4-hour chart, it is evident that the price has finally dropped below the middle trendline of the ascending channel. Ripple is returning to the broken level at $0.49, forming a pullback.
Furthermore, during the recent market turmoil, the price has also declined below the ascending trendline (marked in green). It is currently testing it through a pullback at the same level as the middle trendline of the channel.
Consequently, if both the channel’s middle trendline and the ascending green trendline reject the price, there is a strong possibility of a cascade toward the static support region at $0.42.
The post Will XRP Explode Above $0.5 or Will The Correction Deepen? (Ripple Price Analysis) appeared first on CryptoPotato.