Will Cardano Lose This Critical Support? Here’s the Next Bearish Target (ADA Price Analysis)
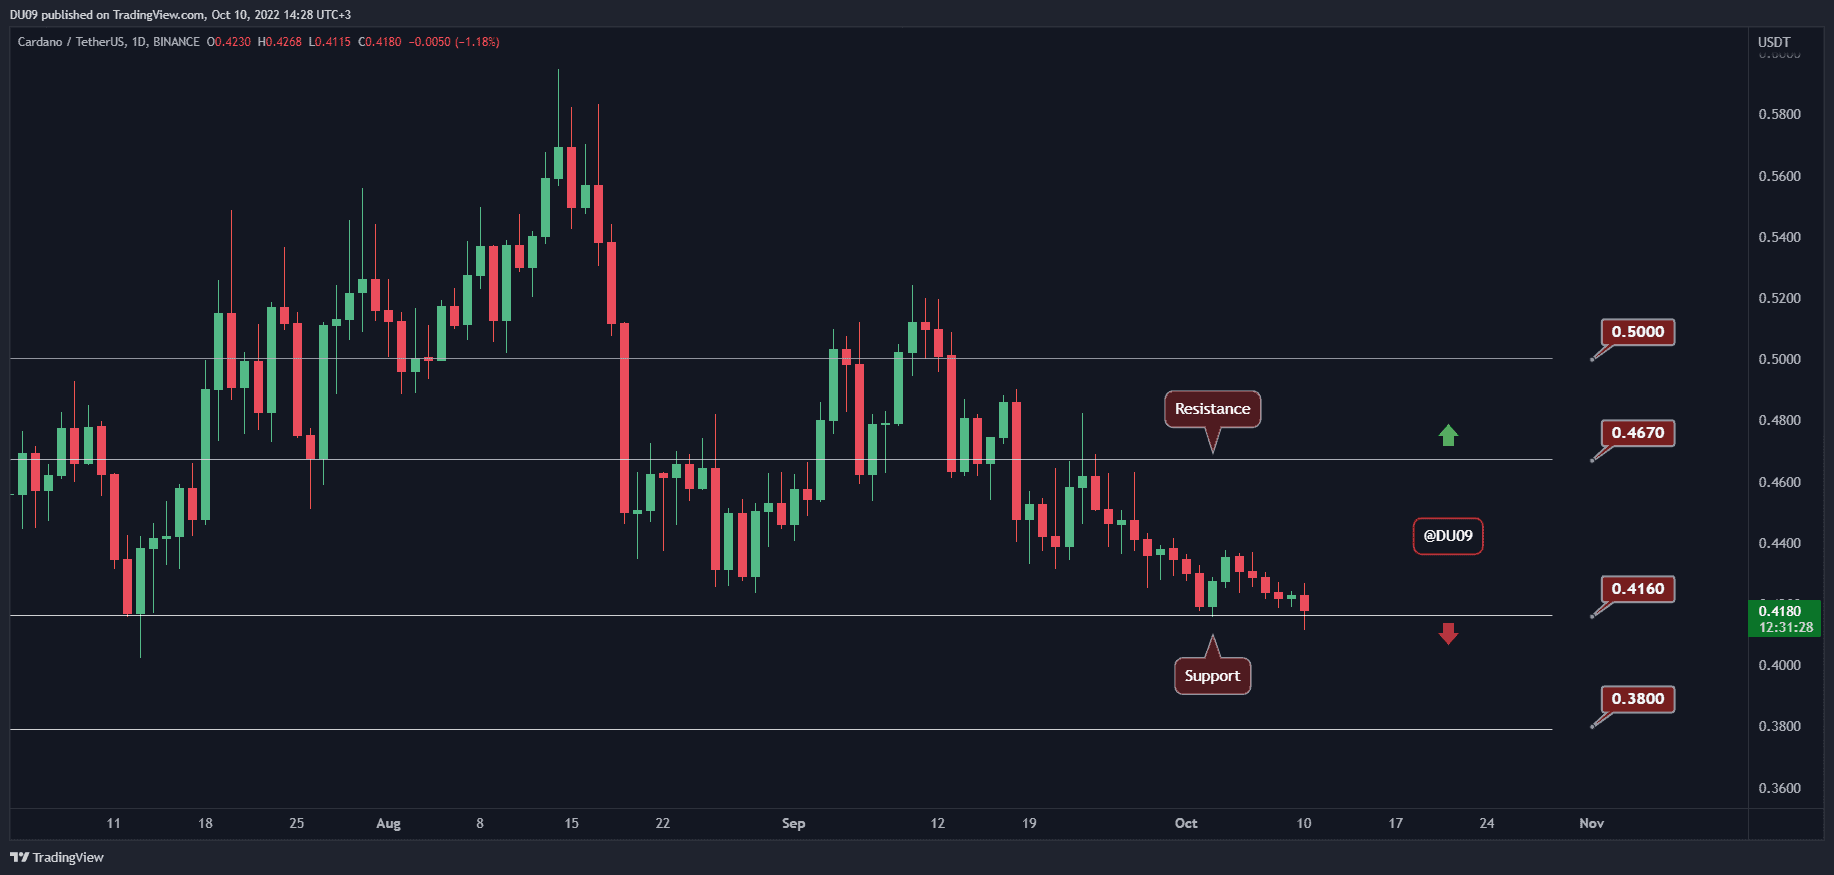
Cardano’s price continues its downtrend and seems about to fall below a critical support level that may take ADA below 40 cents.
Key Support levels: $0.42, $0.38
Key Resistance levels: $0.47, $0.50
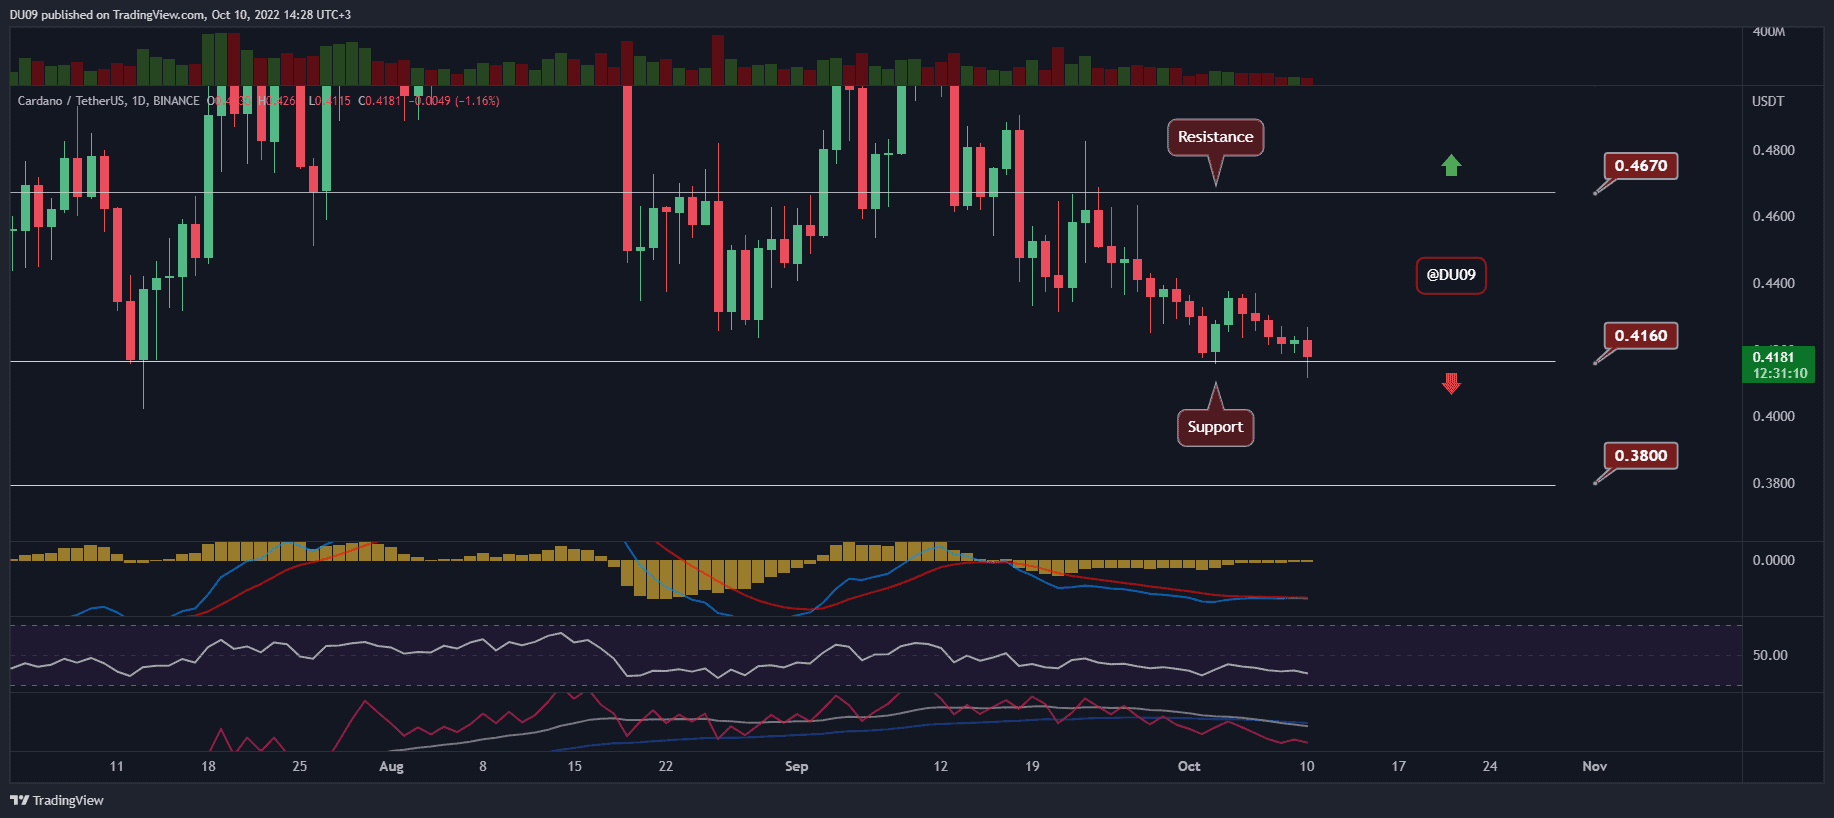
Buyers have failed to stop the downtrend and ADA is facing a critical level. If sellers manage to break below $0.42 and sustain the pressure, then the cryptocurrency would be more likely to fall toward $0.38. The resistance is at $0.47. Due to the lack of buying momentum, ADA seems unlikely to make a recovery any time soon.

Technical Indicators
Trading Volume: The volume has been flat and mostly closed in red. This means that bears control the price action.
RSI: The daily RSI is falling and is under 40 points. At this rate, if the selling continues, the RSI may even reach oversold conditions (under 30) in the coming days.
MACD: The daily MACD is bearish. The sell momentum does not appear very strong, but bears continue to dominate the price.

Bias
The bias for ADA is bearish.
Short-Term Prediction for ADA Price
With this latest push from sellers, ADA is found in a difficult position. A failure to defend the price at the key support of $0.42 will mean a quick defeat and collapse to $0.38. This is the most likely scenario for Cardano if nothing changes in the price action soon.
The post Will Cardano Lose This Critical Support? Here’s the Next Bearish Target (ADA Price Analysis) appeared first on CryptoPotato.


