Why the Solana (SOL) Price is Up Today
TL;DR
- The cryptocurrency market is experiencing a significant upswing, with most digital assets, including Solana (SOL), recording substantial gains.
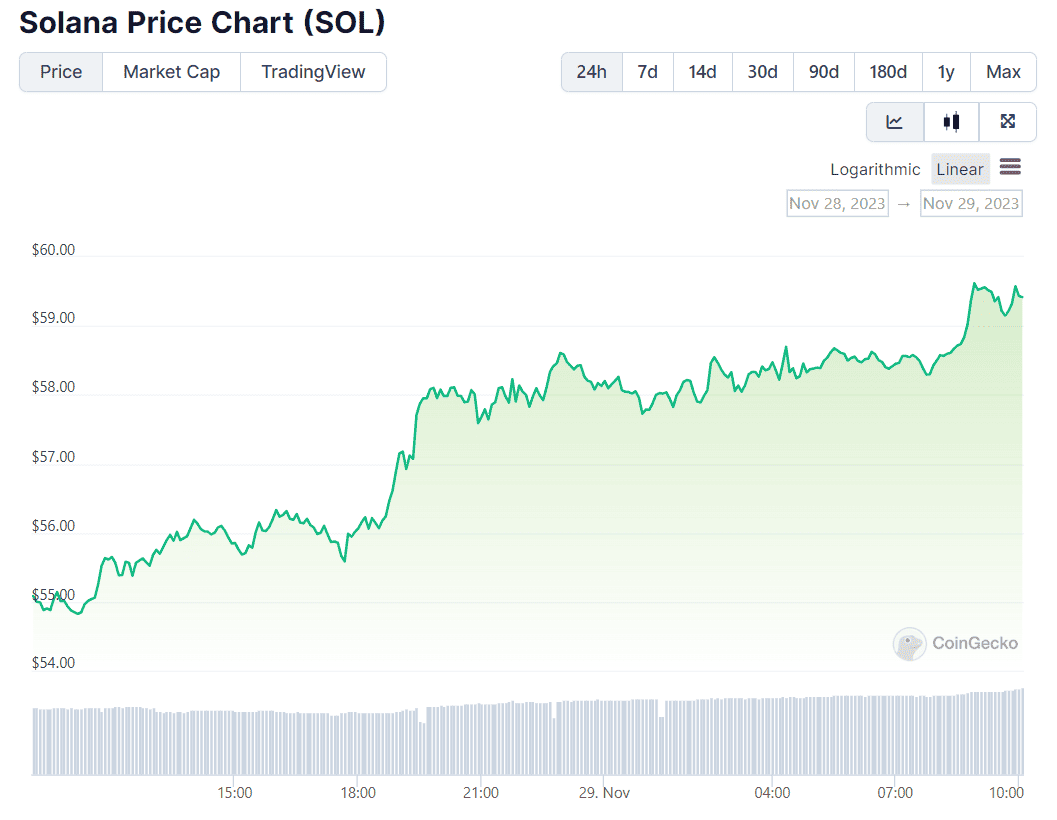
- Solana has notably increased by over 8% in 24 hours and has seen an impressive 80% rise in the past month, with its price reaching nearly $70 at one point.
- The surge in Solana’s price could be partly attributed to the performance of the Solana-based memecoin Bonk (BONK), which has increased by 17% in the past 24 hours and 600% over the last 30 days, especially following KuCoin’s introduction of the BONK/USDT trading pair.

The cryptocurrency market has once again flashed green today (November 29), with most digital assets charting substantial gains.
One of the tokens standing out as a top performer is Solana (SOL), which has jumped by over 8% (per CoinGecko’s data) on a 24-hour basis.

One reason behind the asset’s renewed rally could be the prevailing bullish sentiment around it and its impressive price performance in the past few months. Recall that SOL has skyrocketed by 80% in the past month, reaching almost $70 at one point.
Another factor could be the price surge of the Solana-based memecoin Bonk (BONK). As CryptoPotato reported, the token soared 12% yesterday (November 28) following the news that crypto exchange KuCoin introduced the BONK/USDT trading pair.
The memecoin has risen another 17% for the past 24 hours, being a whopping 600% up on a 30-day basis.
The post Why the Solana (SOL) Price is Up Today appeared first on CryptoPotato.


