Why is the Ripple (XRP) Price Crashing Today?
XRP turned bearish after sellers took control of the price action earlier this month. Let’s examine a few different technical indicators that may provide important insights into where the market is currently at and where it might be headed next.
Key Support levels: $0.43
Key Resistance levels: $0.54
1. Ripple Price Loses Key Support
Unfortunately for bulls, the support at 54 cents was lost and has now turned into a key resistance. If buyers are unable to reclaim this level, then the XRP price has a good chance to revisit the key support at 43 cents.
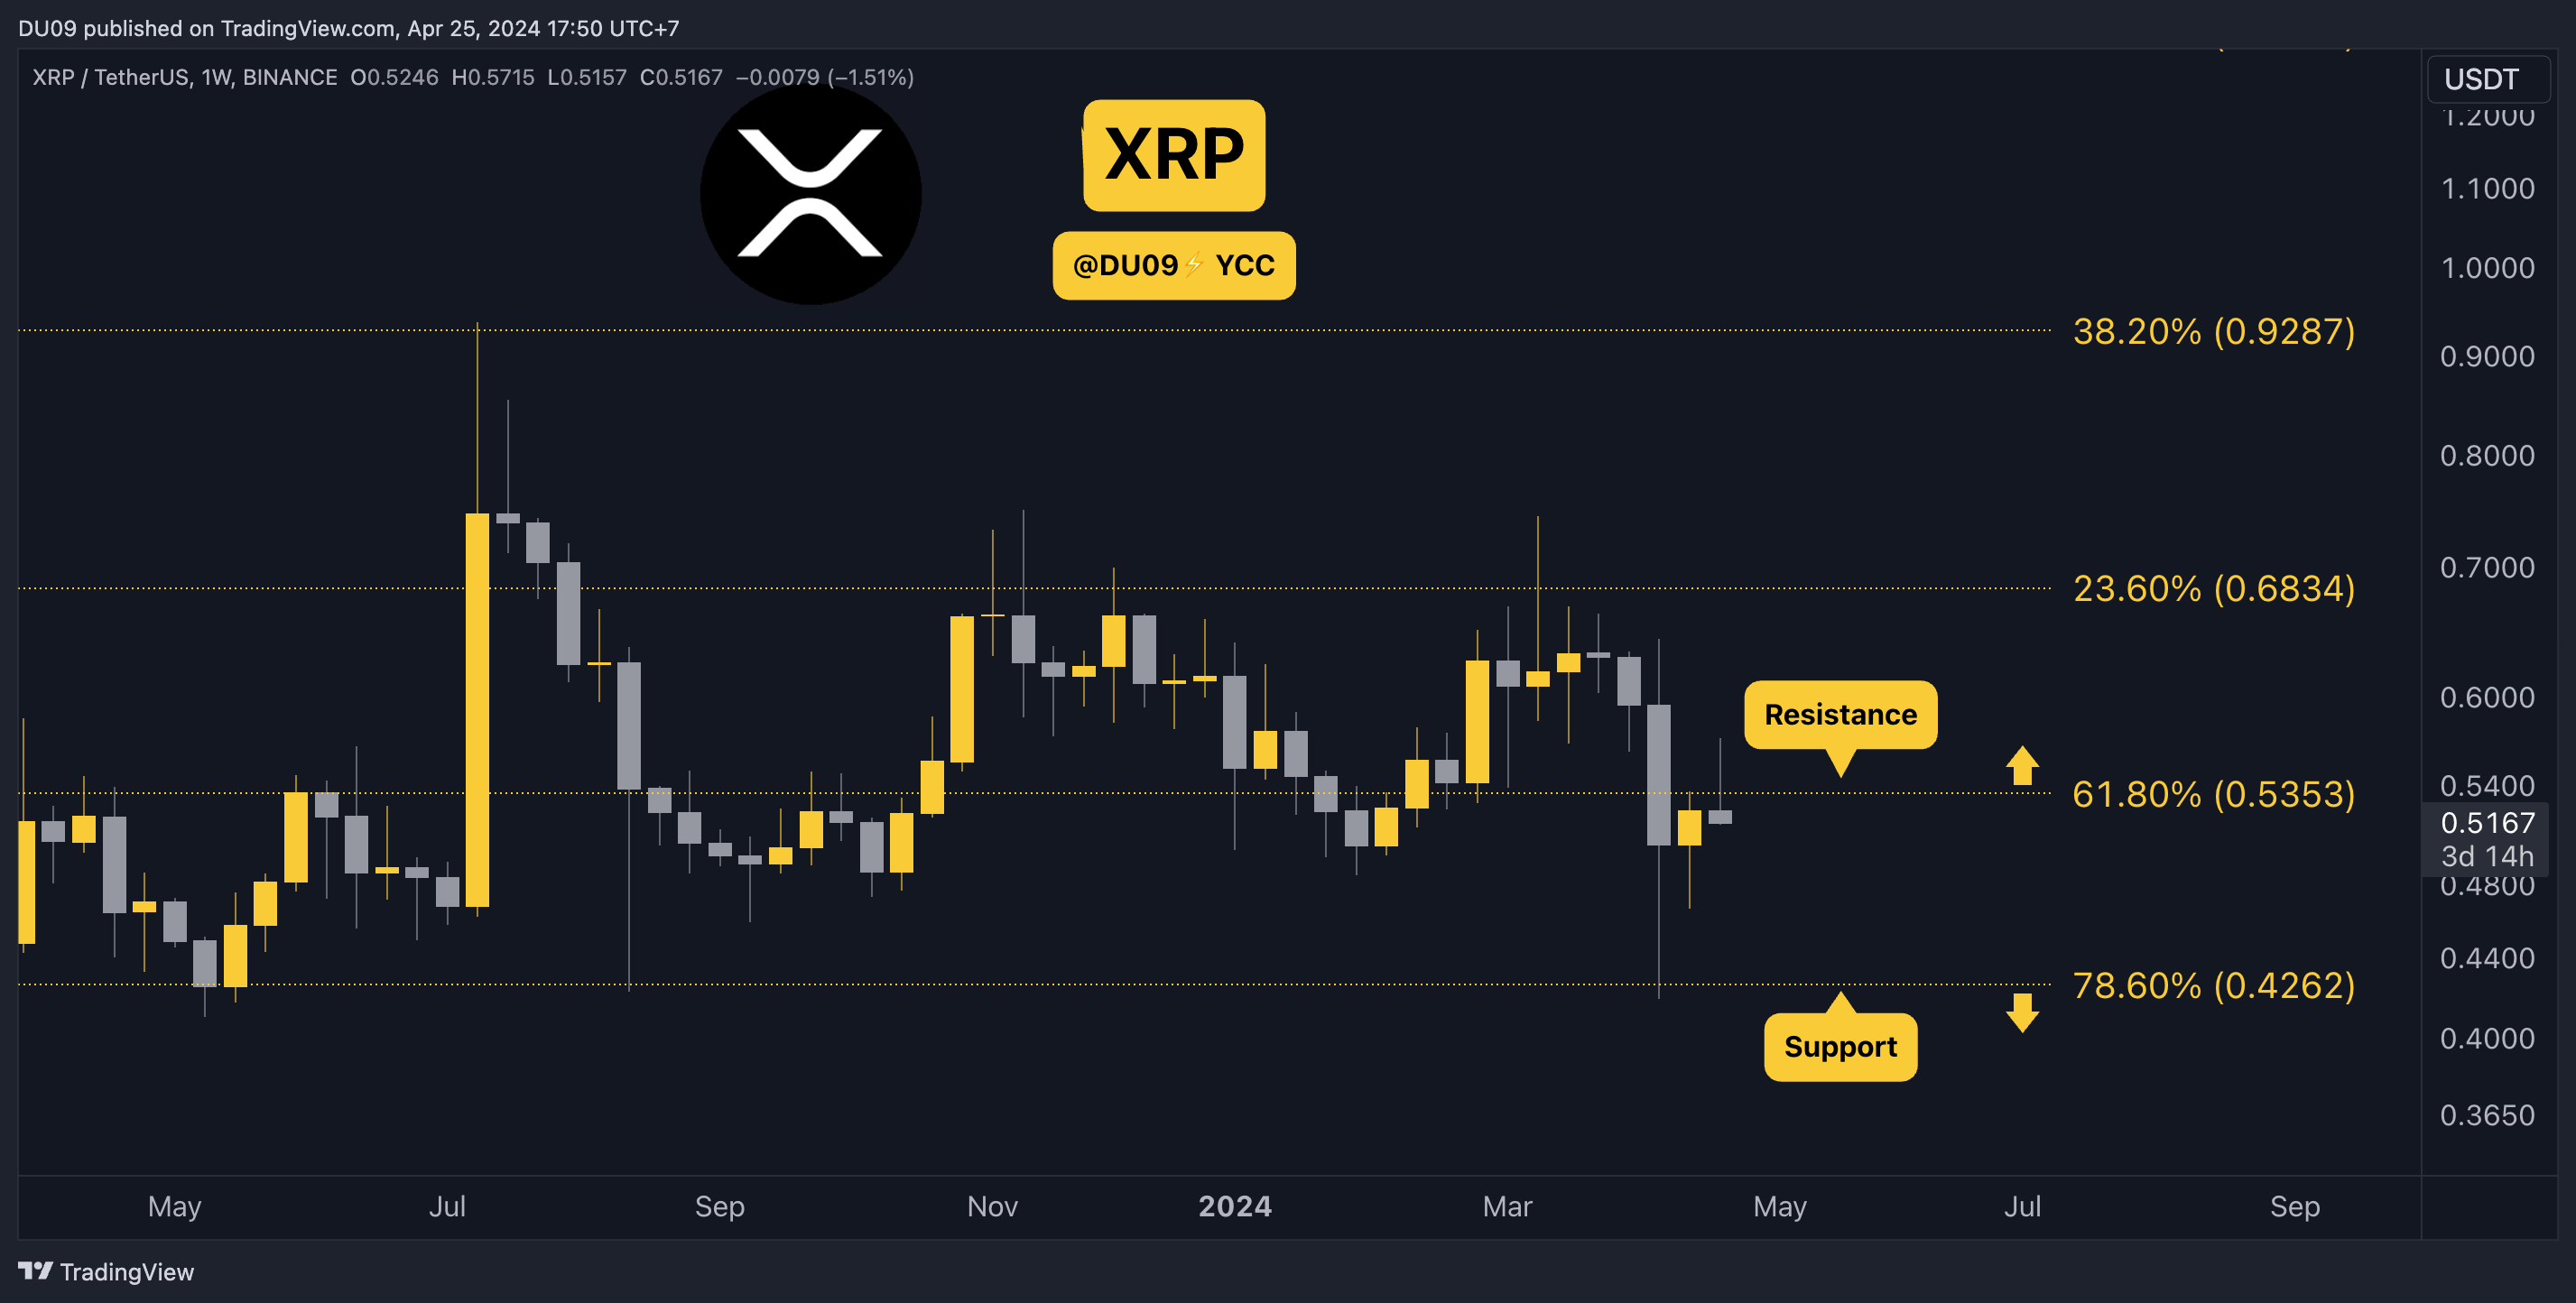
2. Momentum Turns Bearish
Since XRP made a lower high in early March, the price entered a prolonged downtrend. This culminated with a local low at 43 cents during the crash in mid-April. The bias is bearish, and the 43-cents level must be maintained to avoid new lows.
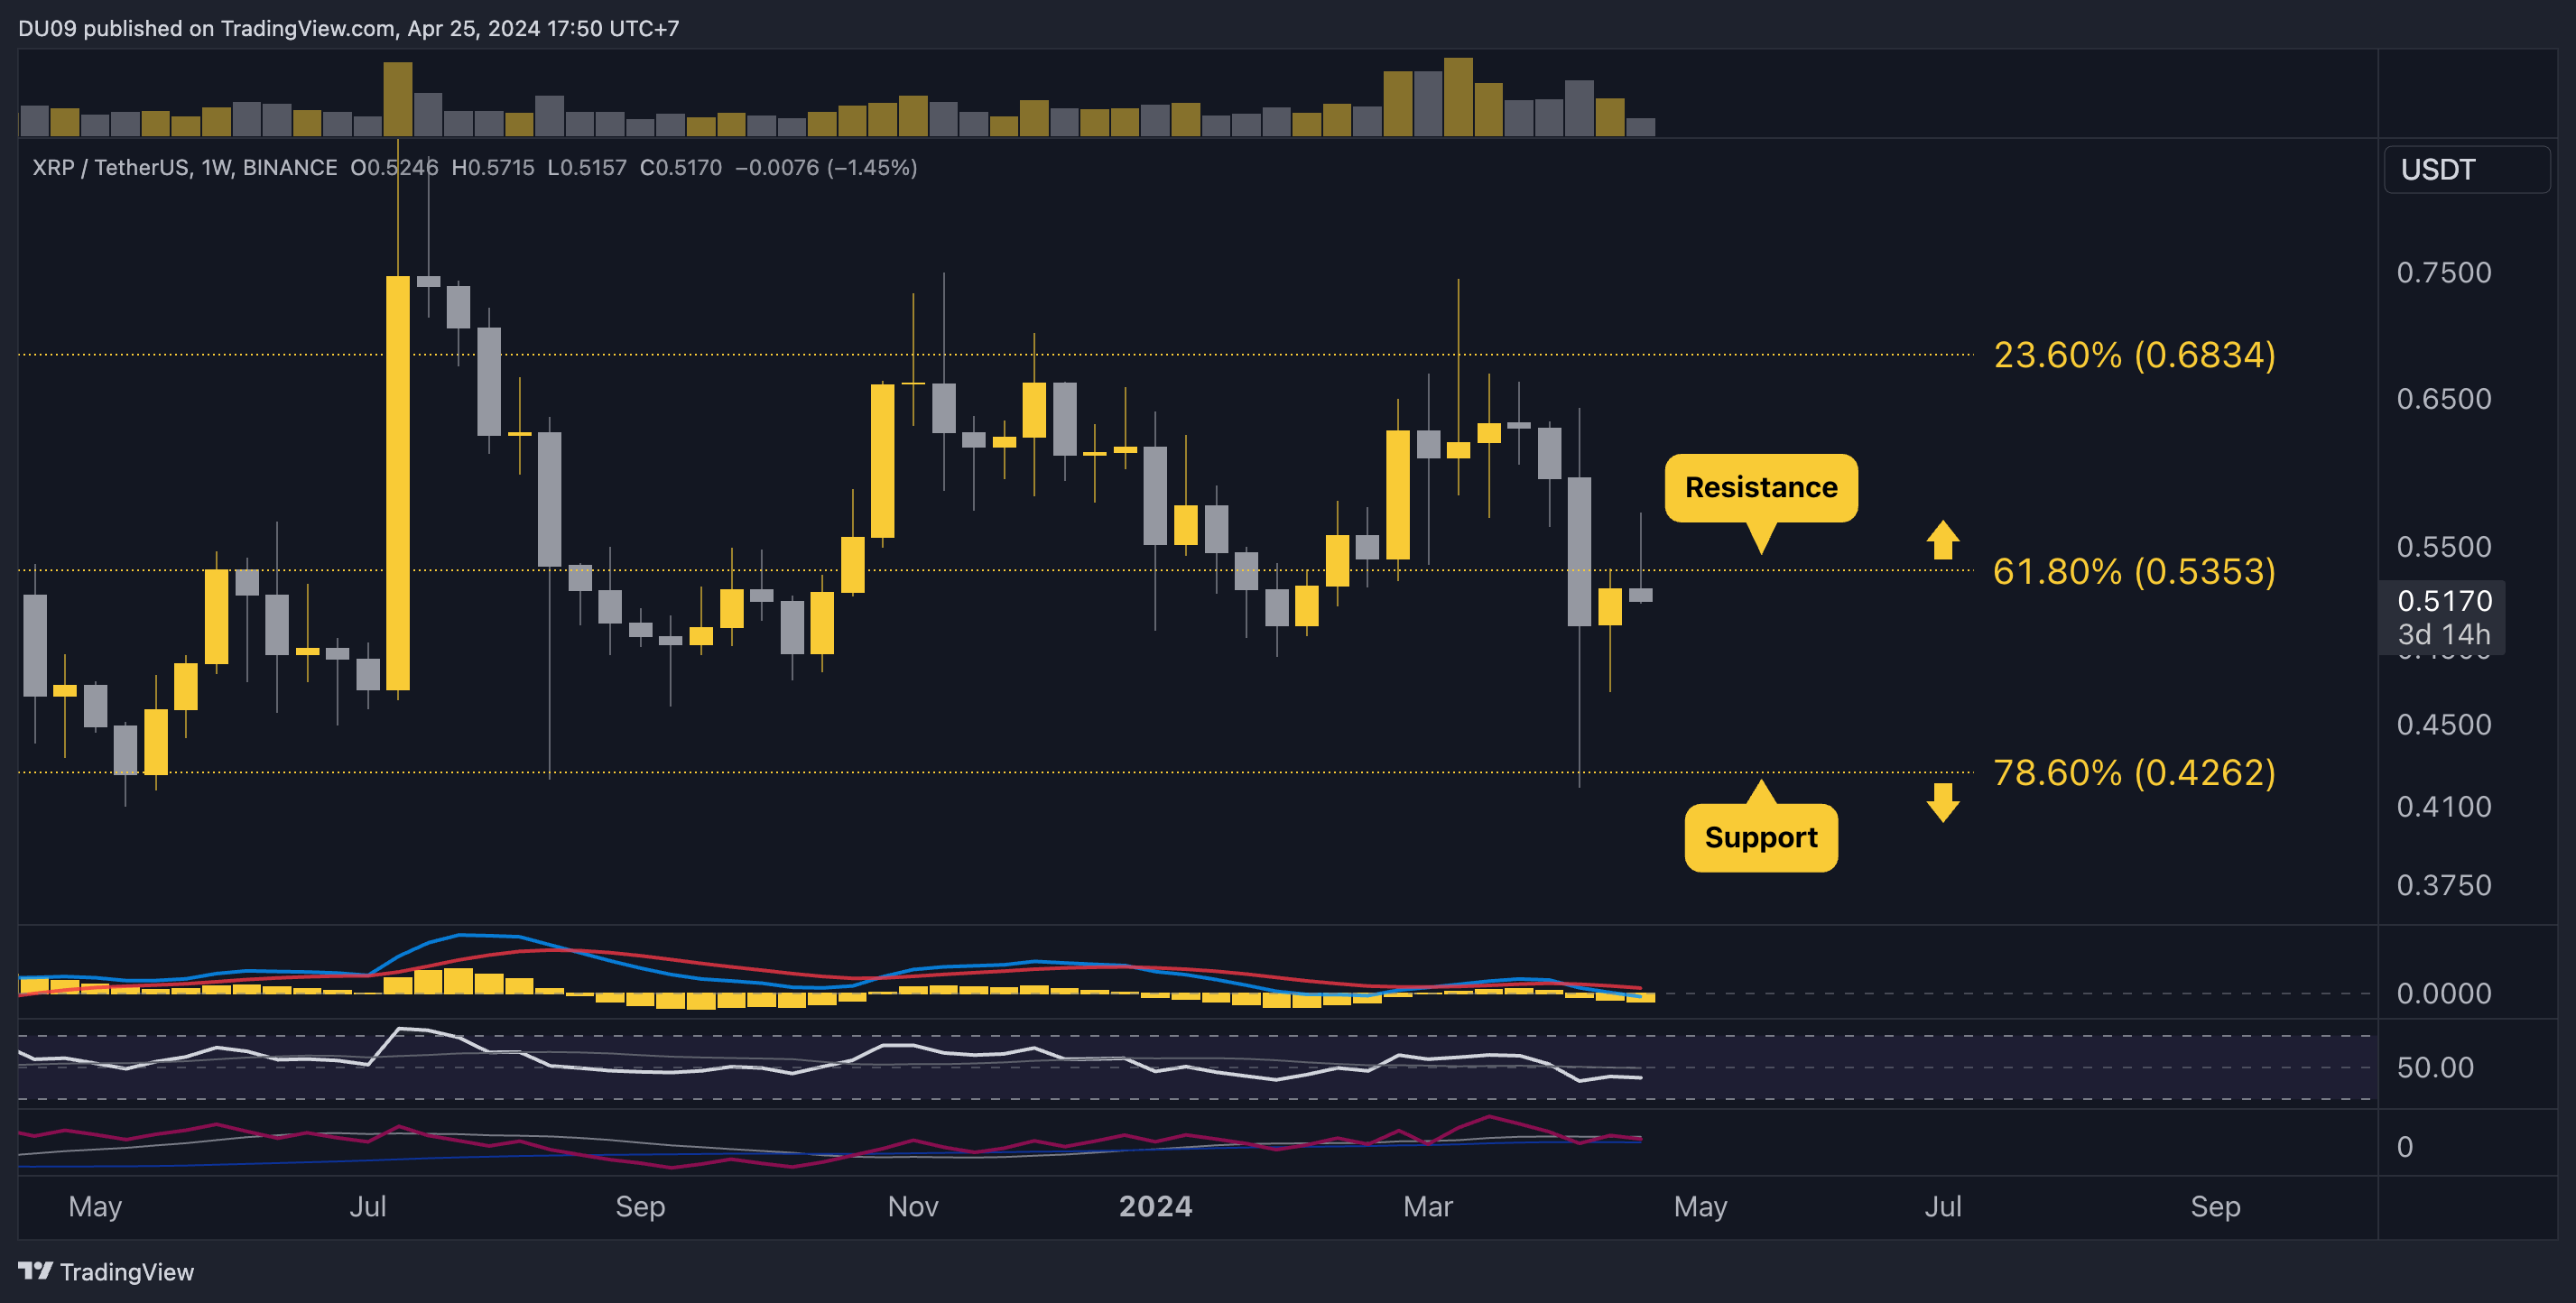
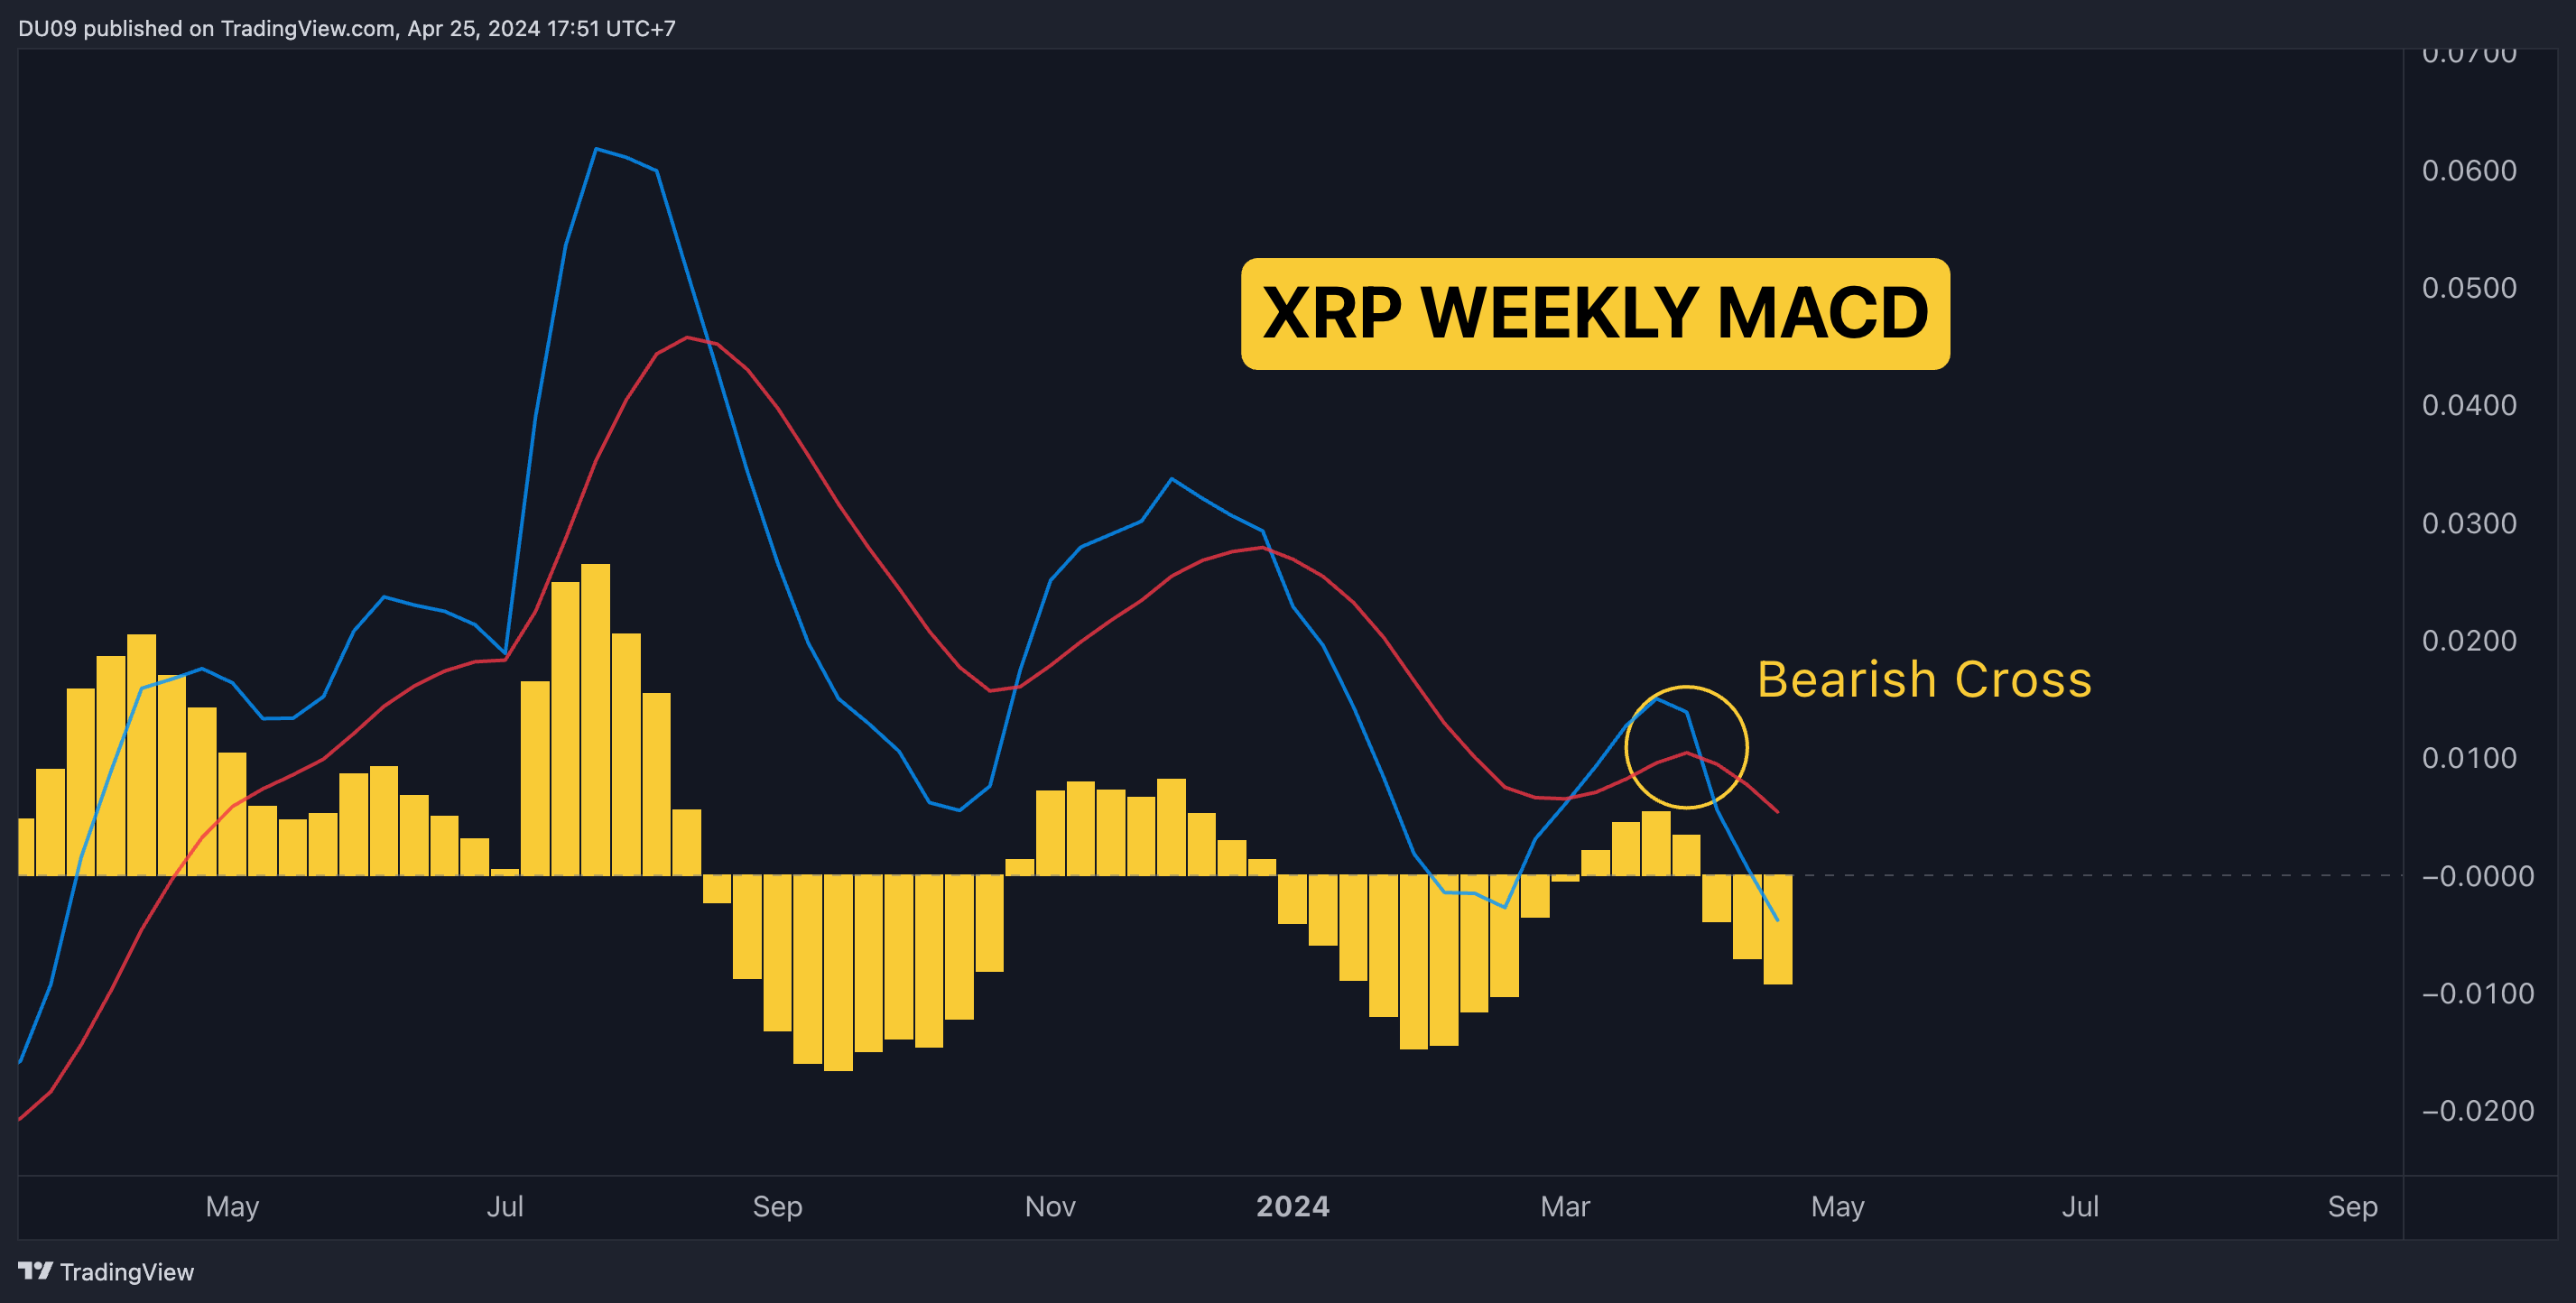
3. MACD Shows Bears are in Control
The weekly MACD did a bearish cross this month. The moving averages continue to fall, and the histogram also makes lower lows. As long as this continues, there is little hope of a reversal.
The post Why is the Ripple (XRP) Price Crashing Today? appeared first on CryptoPotato.