Where Are They Now? Binance IEOs ONE, MATIC, CELR and FET Far From Past Highs
Over the past few months, Binance’s Initial Exchange Offerings (IEOs) have shown similarities to the ICO markets of 2017, posting some interesting price action at the time of launch as well as weeks afterward. ONE, MATIC, CELR, FET and BTT have all been referenced fairly frequently in the trading department of Crypto Twitter. These assets’ markets seem to have cooled off, at least for now, based on their daily candle charts.
| Name | Hardcap | CryptoPotato Score | |
|---|---|---|---|
 Harmony |
$23.0/23.0 M(100%) | 9/10 | More Infromation |
 Matic Network (Binance Launchpad) |
$5.0/5.0 M(100%) | 8.7/10 | More Infromation |
 Celer Network (Binance Launchpad) |
$4.0/4.0 M(100%) | 8.5/10 | More Infromation |
 Fetch AI (Binance Launchpad) |
$21.0/21.0 M(100%) | 8.3/10 | More Infromation |
 BitTorrent (Binance Launchpad) |
$7.2/7.2 M(100%) | 0unrated | More Infromation |
Harmony (ONE)
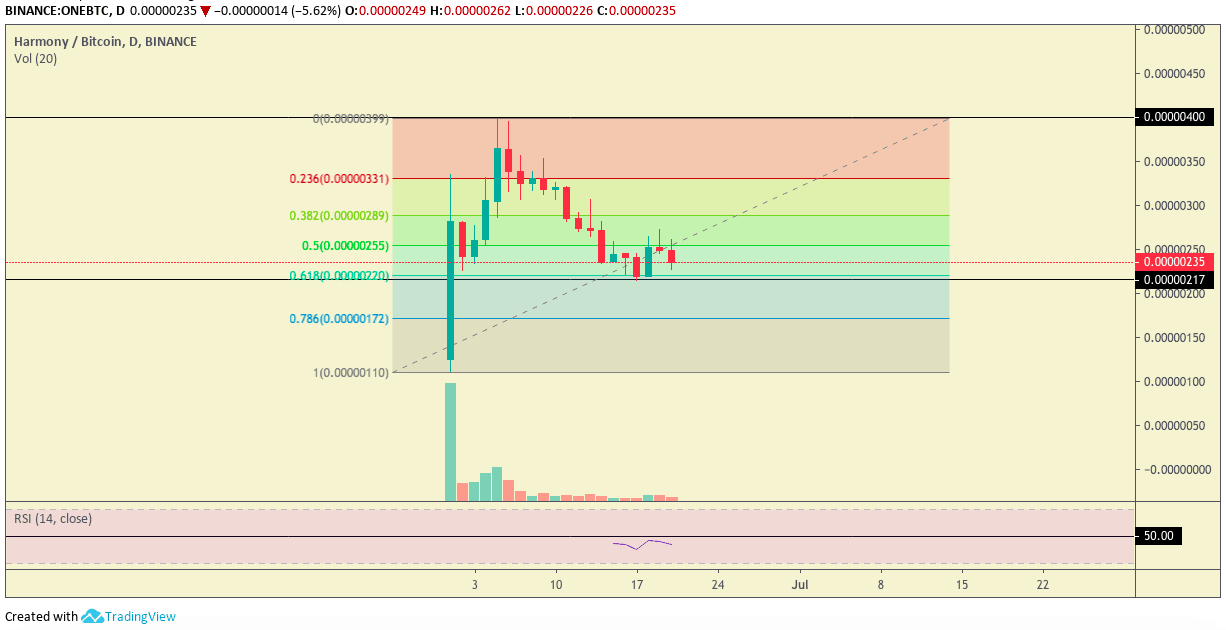
Binance hosted the ONE IEO not too long ago, so there is not much price data available yet. At present, ONE looks to have bounced off the popular 0.618 Fibonacci (Fib) level as support at 217 satoshi. Following said bounce, however, the asset appears to have faced a bit of resistance at the 0.5 Fib level.
Based on the small amount of data used, the relative strength index (RSI) lies just under the 50 mark. The volume also understandably has declined, with the initial hype having dissipated a bit after the IEO launch. The chart shows roughly 400 sat as the all-time high price for ONE.
Matic Network (MATIC)
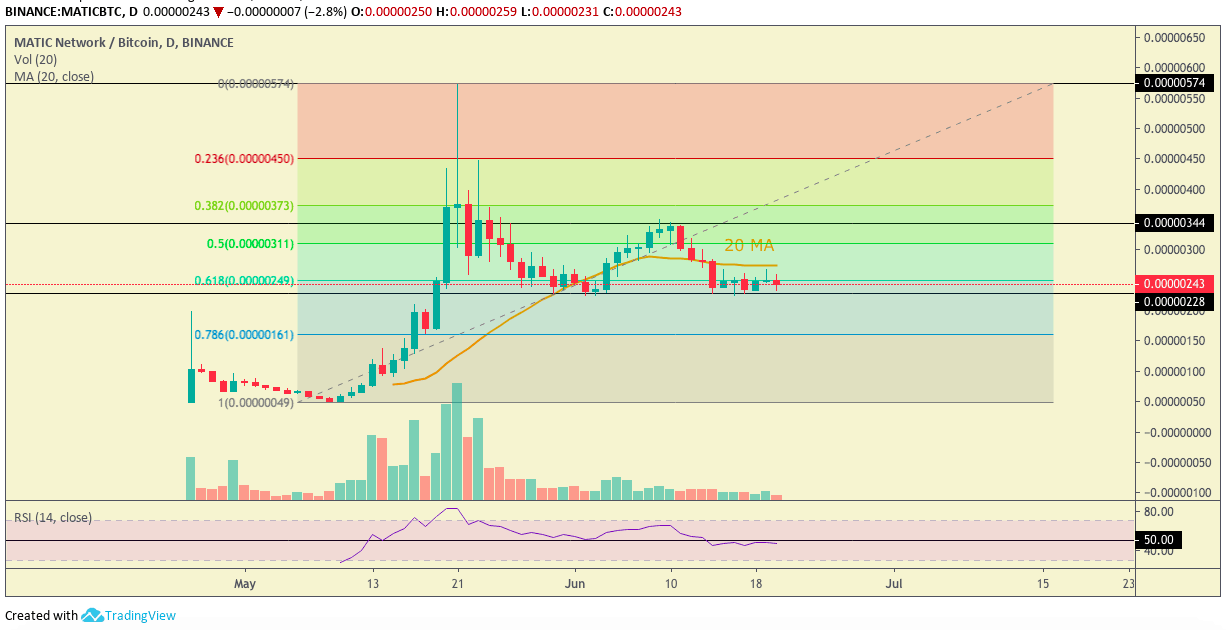
MATIC IEO offers slightly more data than ONE, but still not enough to draw much analysis from various moving averages and the like. Interestingly, MATIC looks very similar to ONE in its bounce off the 0.618 Fib level. MATIC seems to have faced resistance between the 0.382 Fib level and the 0.5 Fib level at a price of around 344 sat. At present, the asset’s price lies around the 0.618 Fib level.
MATIC’s price is below the 20-day moving average (MA) line, with noticeably less volume than at the time of its drive to its all-time high price of around 574 sat. Additionally, the RSI sits right below the 50 mark.
Celer Network (CELR)
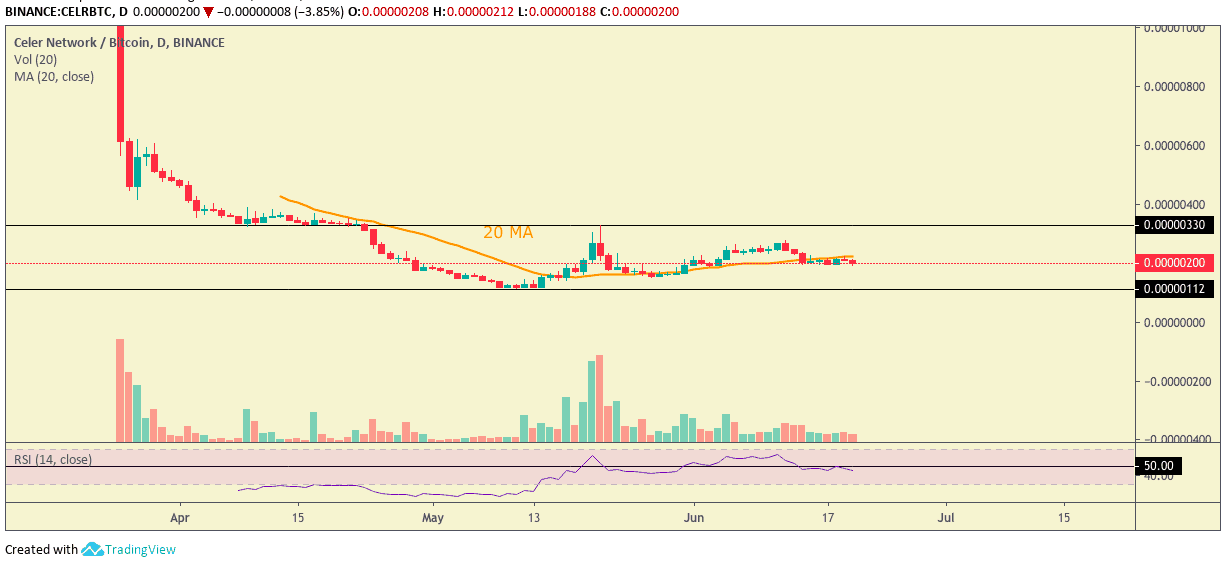
In contrast to the ONE and MATIC IEO launch pumps, CELR appears to have ‘died’ after its launch. The asset’s price has exhibited a continuous fall, down to its most recent bottom around 112 sat.
Resistance appears to have held around 330 sat, around where previous support once existed. At press time, the asset was below the MA-20, with RSI also below 50. Trading volume posted heightened levels when the asset retested previous support around 330 sat, but the asset was unable to close above that level.
Fetch (FET)
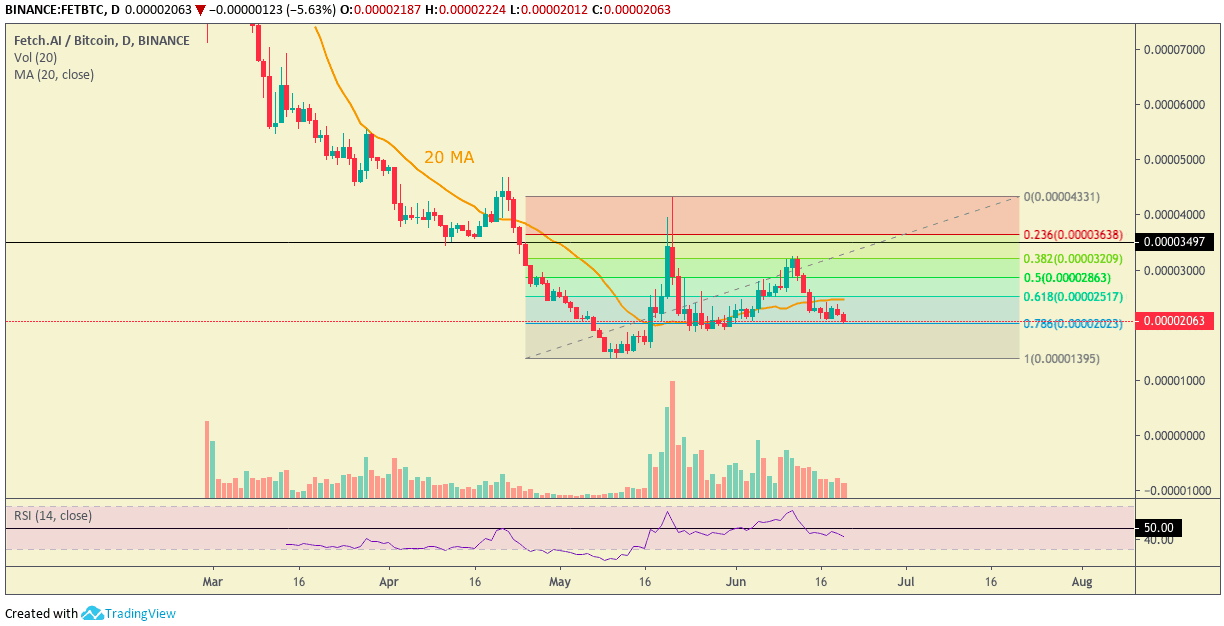
FET IEO shows similar price action to CELR with regards to a post-IEO launch dump. The asset’s price fell from around 14,032 satoshi down to a recent bottom around 1,404 sat. The trend appears to suggest an attempted reversal.
Based on the recent price bottom, FET looks to have bounced off the 0.786 Fib mark, facing resistance at the 0.382 Fib level. At press time, the price was back at the 0.786 Fib level.
The price is currently below the 20 MA, with RSI below 50. Recent volume, however, has been consistently higher compared to last month.
Based on their charts, all four of these assets look to be down considerably from their price highs. MATIC, CELR, and FET are all below their MA-20, and all four assets have RSIs below 50.
*This article is based on the author’s opinions, speculations, and conclusions.
The post Where Are They Now? Binance IEOs ONE, MATIC, CELR and FET Far From Past Highs appeared first on CryptoPotato.

