What’s Next For Ripple Following the Drop Below $0.6? (XRP Price Analysis)
The crypto market experienced a sharp drop yesterday, liquidating many long positions. A lot of cryptocurrencies are approaching their long-term support levels, and it remains to be seen how bulls will defend them.
Technical Analysis
By Grizzly
The Daily Chart
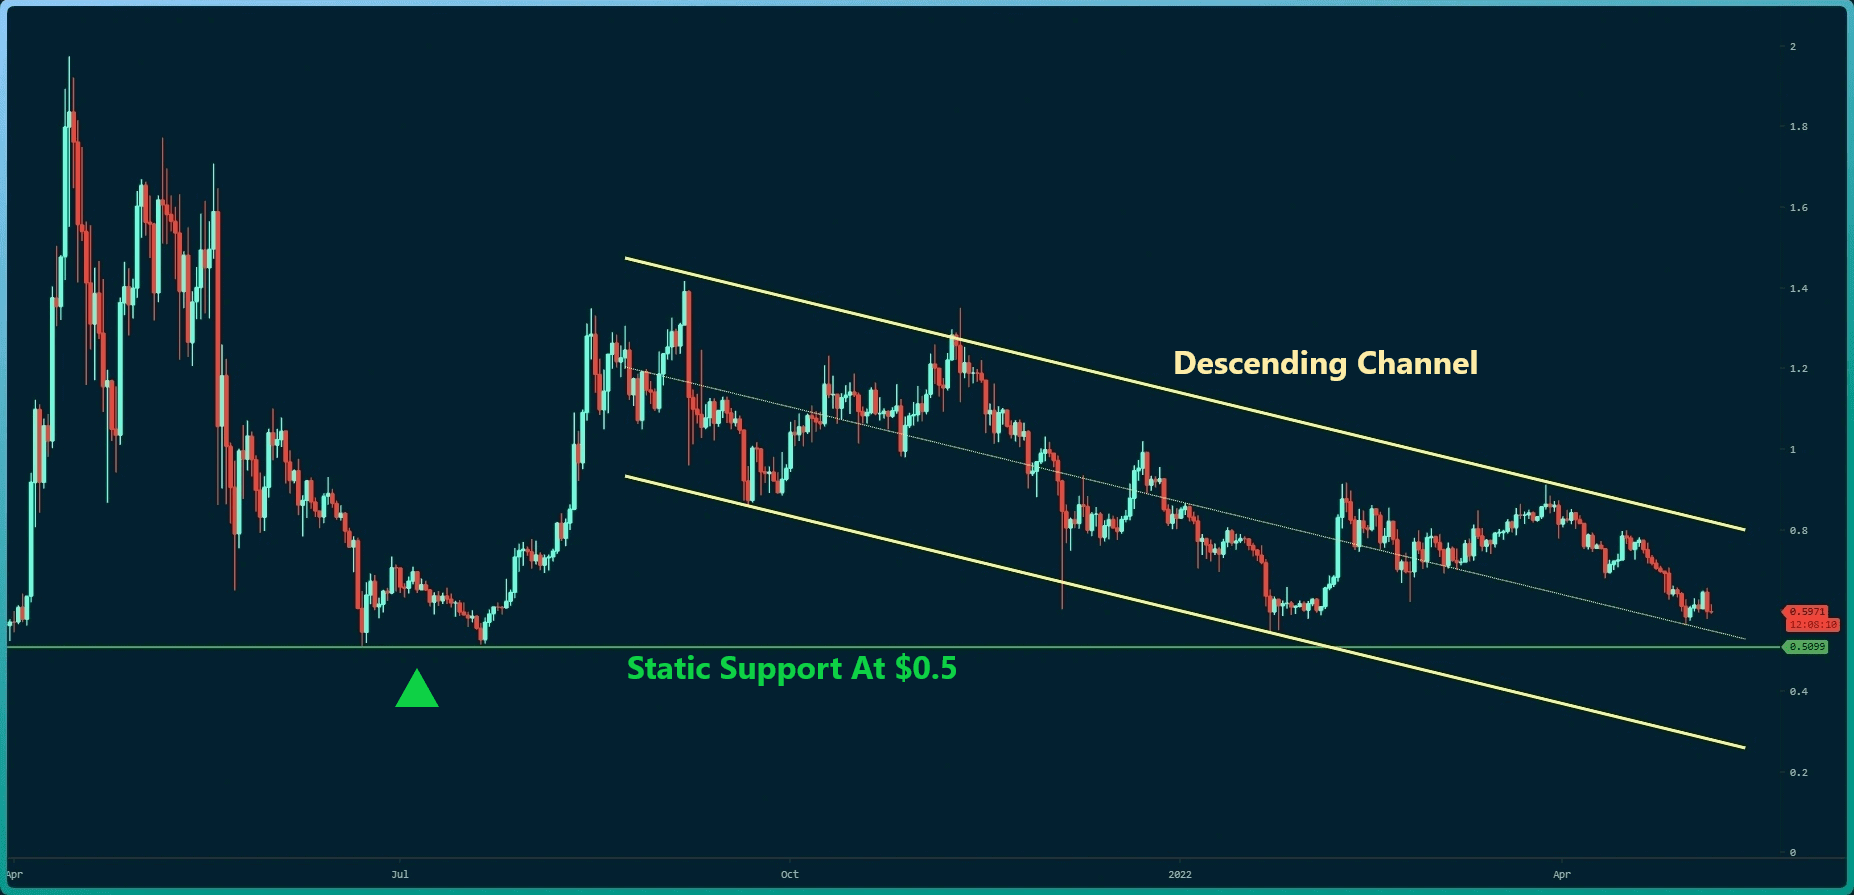
On a daily time frame, XRP moves down inside a descending channel (in yellow). The intersection point of the channel’s midline with the horizontal support at $0.5 (in green) is a crucial level to monitor. If the bulls defend it, one can expect the channel top to be retested at around $0.8.
Otherwise, the bears have the potential to push the price down to as low as $0.37. If buyers can hold the price above $0.5 and accumulate in this area, the bearish momentum would fade and open up the doors for a potential move to the upside.
The bottom line is that based on the current sentiment, where the market seems to be in the doubt/fear phase, and buyers are not very inclined to make big purchases.
Moving Averages:
MA20: $0.67
MA50: $0.75
MA100: $0.74
MA200: $0.84
The 4-Hour Chart
On the 4-hour timeframe, although the pressure from sellers has eased, the intersection of the horizontal resistance at $0.63 (in blue) with the dynamic resistance (in red) can be a severe barrier for the price to recover.
Therefore, it’s important to see how the price will behave around it before drawing any further conclusions.