What is a Golden Cross and Why Everyone Thinks Bitcoin Will Skyrocket After It Takes Place?
After months and months of bear market despair, the crypto space has perked itself up over the past several weeks, seeing renewed upward exuberance. As a result of such price action, crypto’s largest asset looks like it’s headed right toward a dominant bullish chart pattern, the Golden Cross.
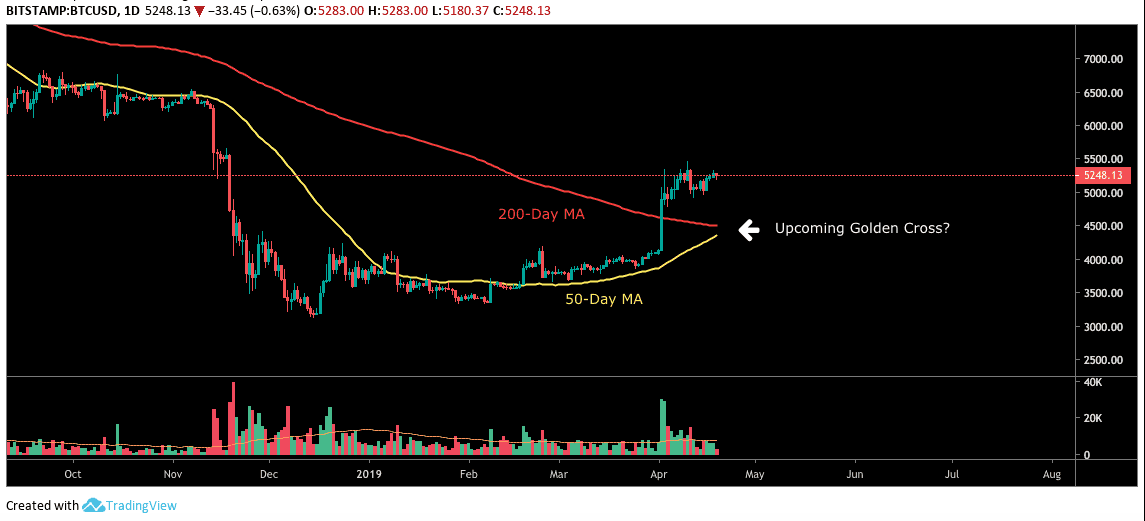
A historically bullish pattern in technical analysis, the Golden Cross occurs when a shorter term moving average (MA) crosses above a longer-term MA. Perhaps two of the most commonly used moving averages for this pattern are the 50-day and 200-day MAs.
At present for Bitcoin, the daily chart 50-day MA looks like it is headed toward the 200-day MA for a potential crossover in the not-so-distant future.
Watch Out For Fake-Outs
Golden cross patterns such as these can sometimes indicate longer-term trends ahead and can be useful in longer-term trend outlooks. Bitcoin also had a Golden Cross near the end of the last bear market cycle back in 2015, indicating on the 2016 – 2017 bull run. Gaining steam during the upward trend, the 50-day MA looked to hold above the 200-day MA as a type of support.
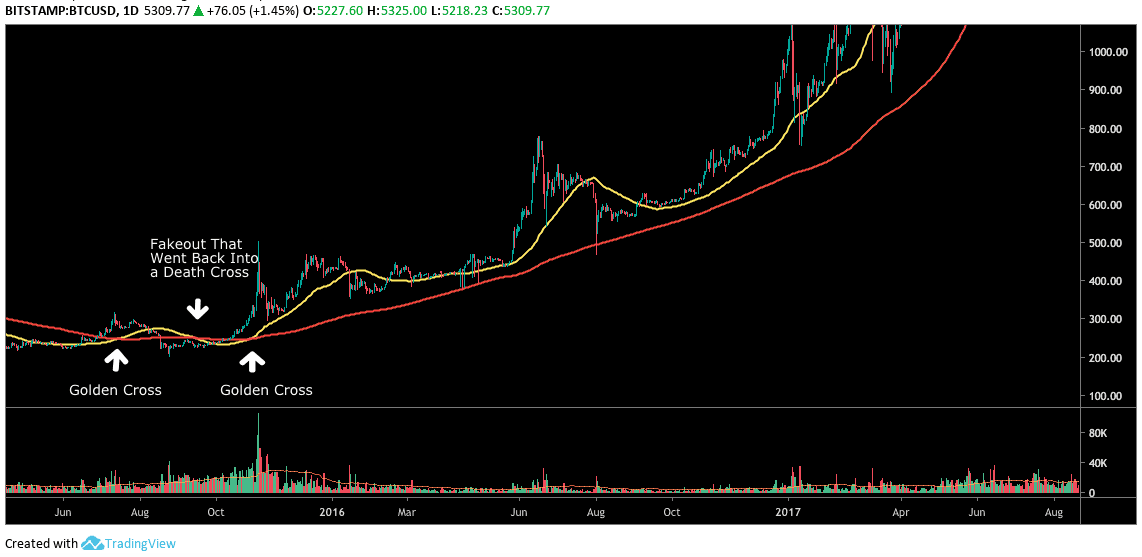
It is, however, essential to note the potential for fakeouts, as with almost any indicator or price pattern. As seen in the chart above, the chart painted two Golden Cross events back in 2015. The first appeared to be a fakeout, with the 50-day MA temporarily crossing back below the 200-day MA, before continuing back upward again.
After the fakeout and second Golden Cross, Bitcoin had a spike up to about $500 and then came down to the 50-day MA, seemingly holding support near the indicator around roughly $300 per bitcoin. The 50-day MA did not cross back under the 200-day MA until after Bitcoin had hit its all-time high around $20,000 (December 2017). As a long-term buy signal, the second Golden Cross obviously would have yielded tremendous returns in this example. Although, as mentioned, false signals do occur, and a bull run of that magnitude obviously is never a guarantee or likelihood.
And There Comes The Death Cross
In addition to the Golden Cross, evaluating various other circumstances, observations and conditions can be imperative in developing a more well-rounded opinion on price action and future speculation.
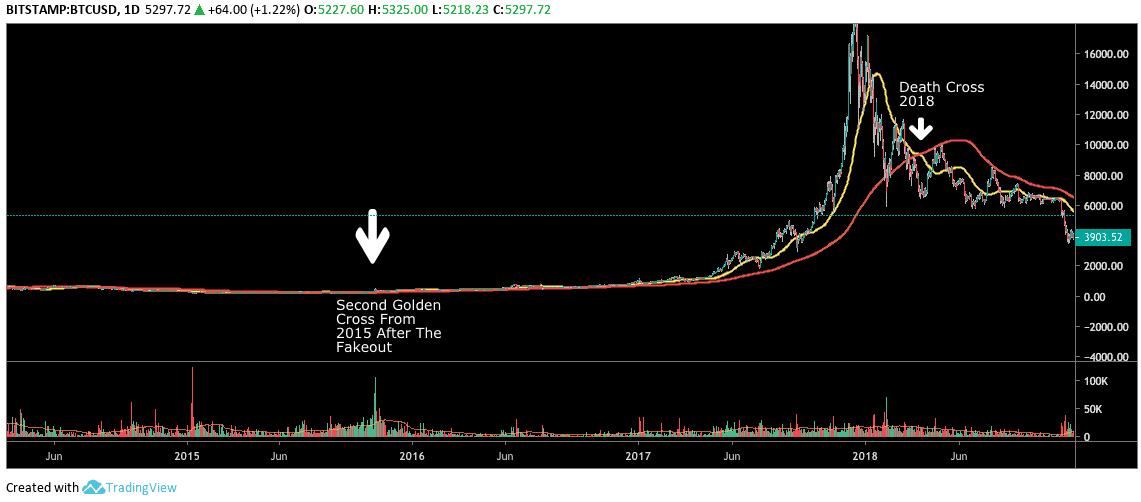
After Bitcoin’s all-time price high, the 50-day MA eventually fell back down through the 200-day MA in a death cross, which took place when Bitcoin was equivalent roughly $10,000, signaling the coming-up bear market the crypto space has faced over the past year. Some say we are not over that bear market yet.
The post What is a Golden Cross and Why Everyone Thinks Bitcoin Will Skyrocket After It Takes Place? appeared first on CryptoPotato.