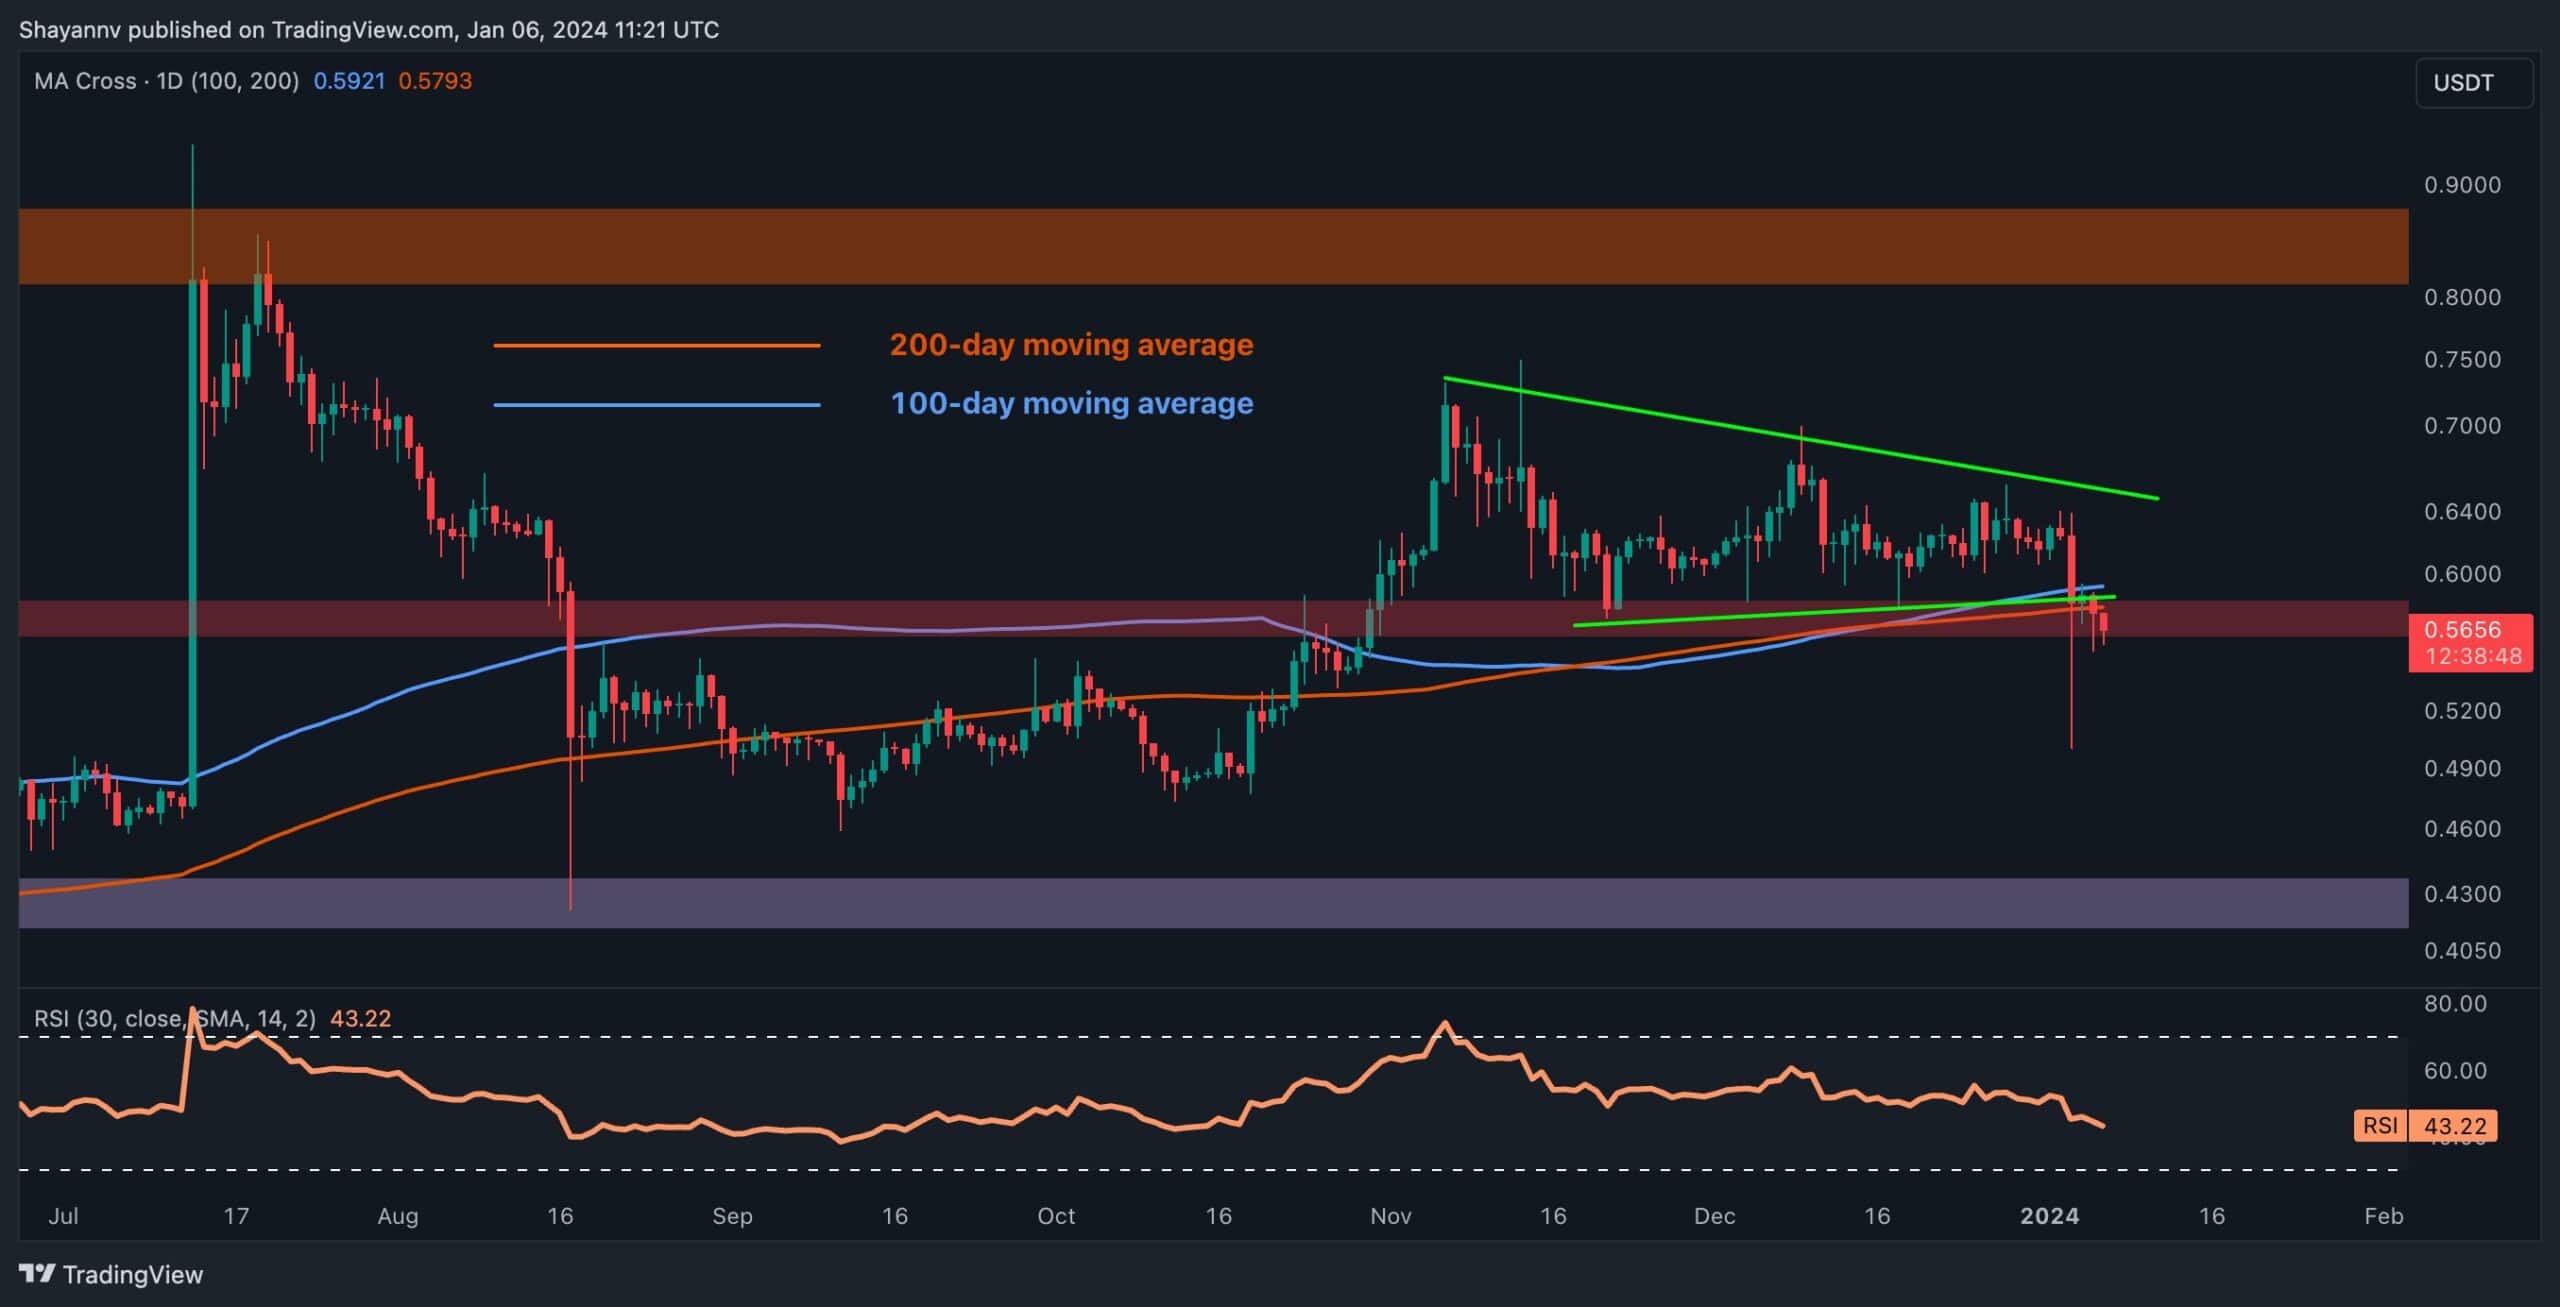
Weekly Price Analysis Overview Feb.5: Bitcoin, Ethereum, Ripple and BNB
Bitcoin
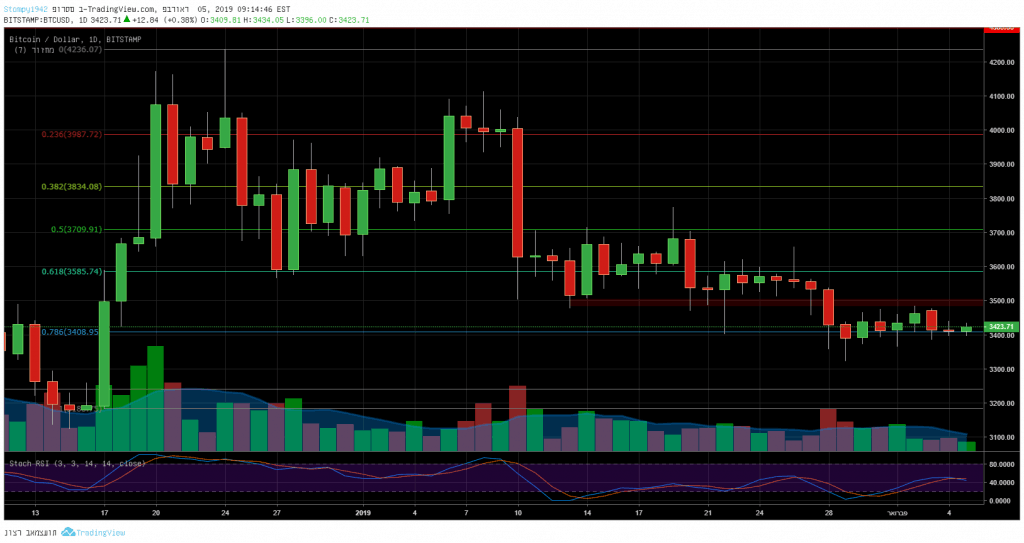
The daily chart reveals a relatively solid week for Bitcoin. The price range of $3360 – $3480 serves as a critical area; however, the feeling is that the support is not safe enough. The resistance area remains around $3500, as of now, there is some stability following the correction.
Ethereum
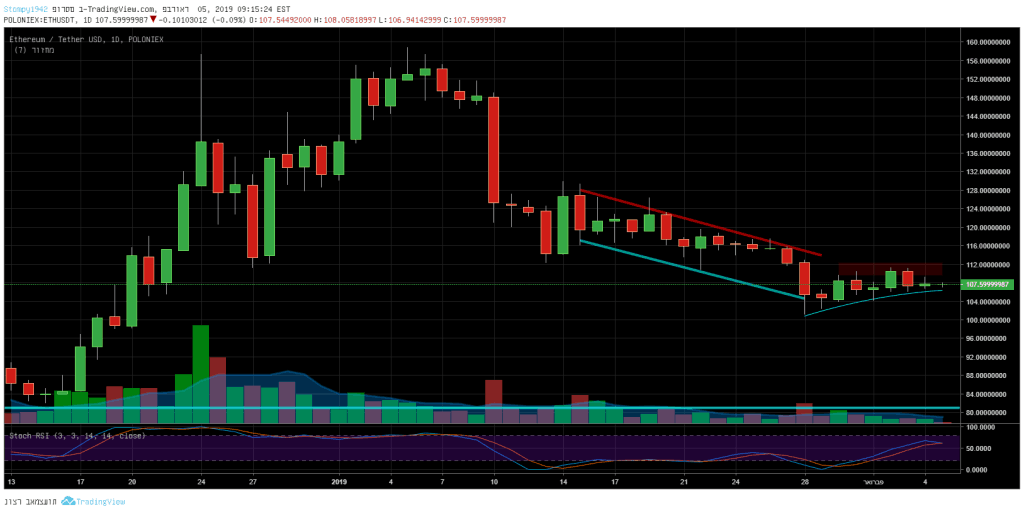
Against the Dollar, the support had held around the $100 mark. The price is stabilizing slightly above the $100 level, while resistance lies at $110 for the short term.
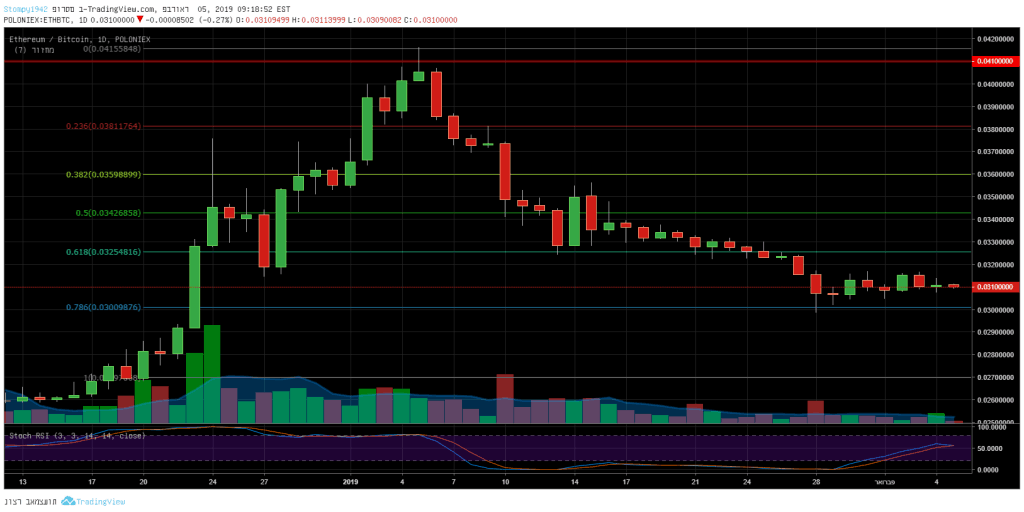
Against Bitcoin, the daily chart show support around the Fibonacci retracement levels which is around 0.03 BTC. Resistance lies at 0.032. The price has been sliding down since the beginning of the year, but the sharp declines have since calmed down (just like in Bitcoin).
Ripple (XRP)
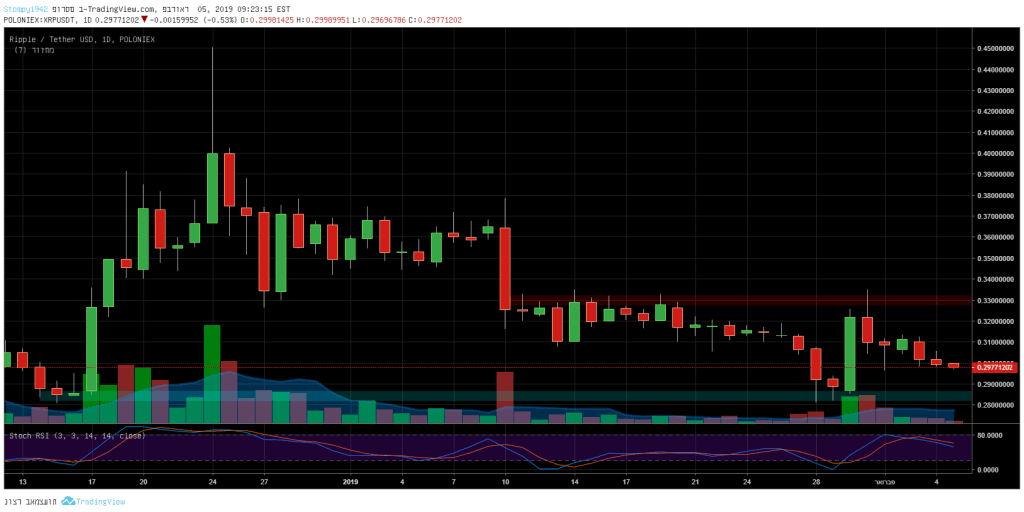
Against the dollar, the daily XRP chart’s support around $0.30 did not hold, and following that, the price dropped down to $0.28, which could end up as a double bottom formation (since December). Resistance lies around $0.33.
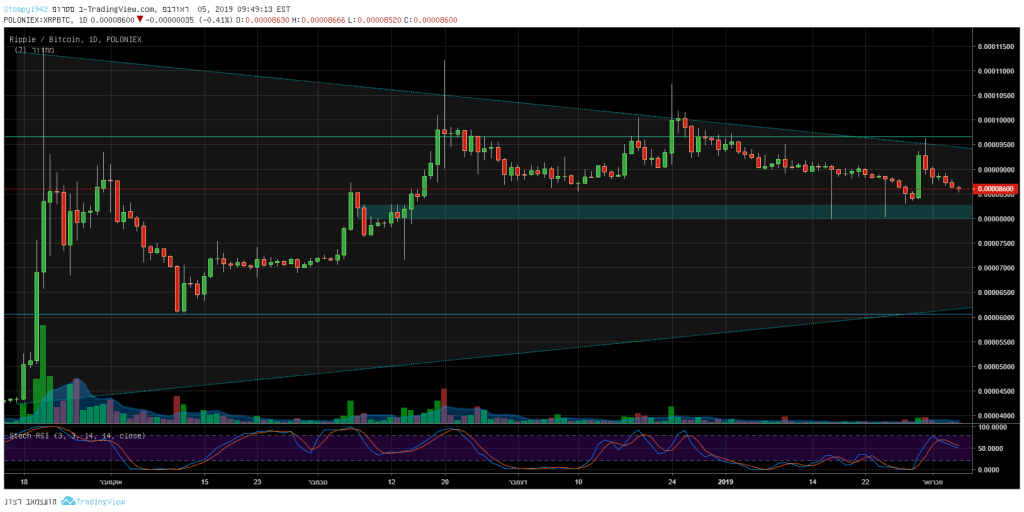
Against Bitcoin, the daily chart tells a different story: The trend is pointing upwards, and the price is hovering around the pattern which is marked on the following chart. The support around 8000 SAT is soon to be tested. Resistance lies at 9500 SAT in the short-time range.
BNB
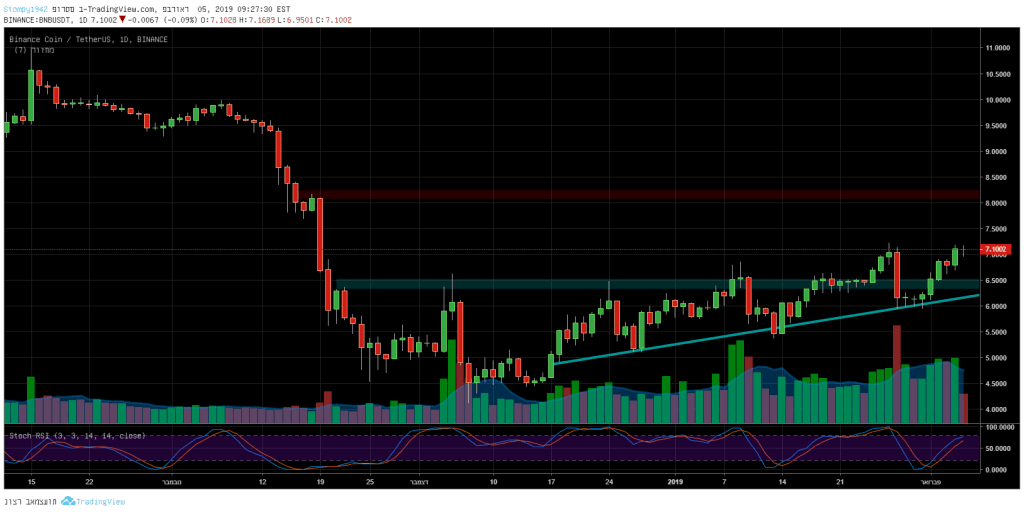
Following the hype around BTT fundraising: Against the Dollar, the trend has been rising since the middle of December 2018. It seems like the coin is gaining momentum, breaking up the $6.5 resistance, where the support lies now (resistance turned support).
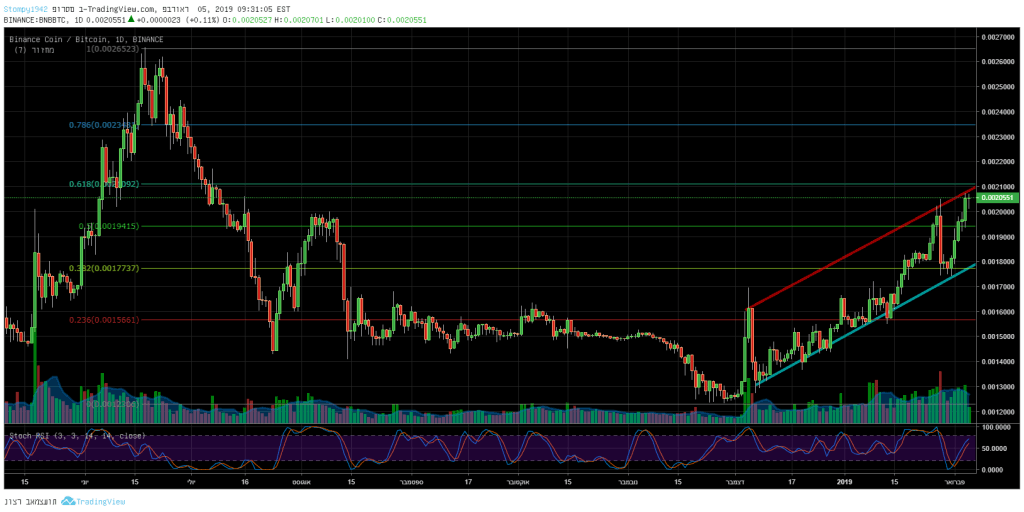
Against Bitcoin, the daily chart shows even more positive story, while the all-time high is in sight. Resistance lies around 0.0021 BTC; support lies at 0.0018 BTC.
The post Weekly Price Analysis Overview Feb.5: Bitcoin, Ethereum, Ripple and BNB appeared first on CryptoPotato.


