Weekly Price Analysis Overview Feb.12: Bitcoin, Ethereum, Ripple, Dash and Monero
Bitcoin
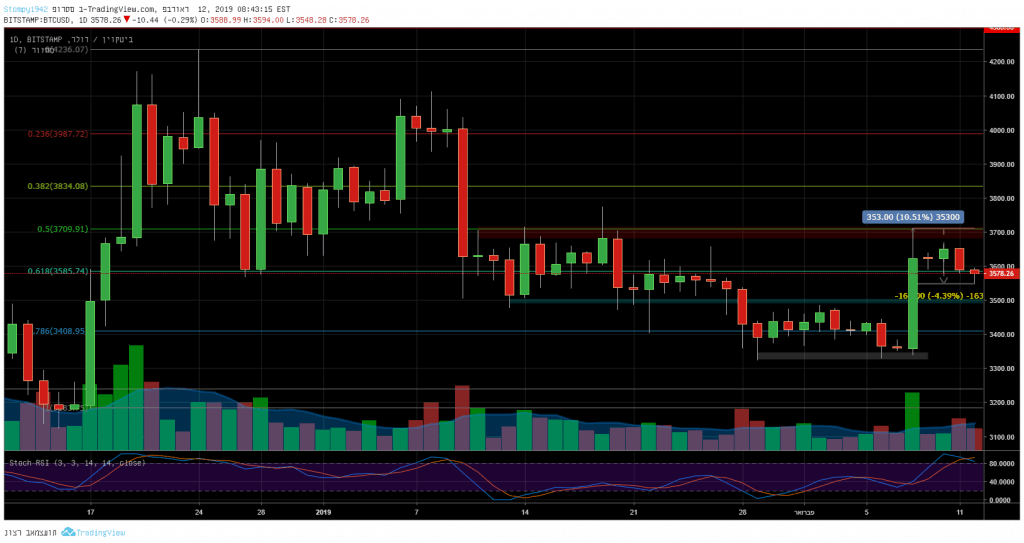
After consolidation around $3,330, along with a significant drop in trading volume and expectations for a further decline, on Feb 8th of the month, a nice candle came up and raised the price by 10%. Following a small correction, support was set at $3,500 with resistance at $3,700.
Ethereum
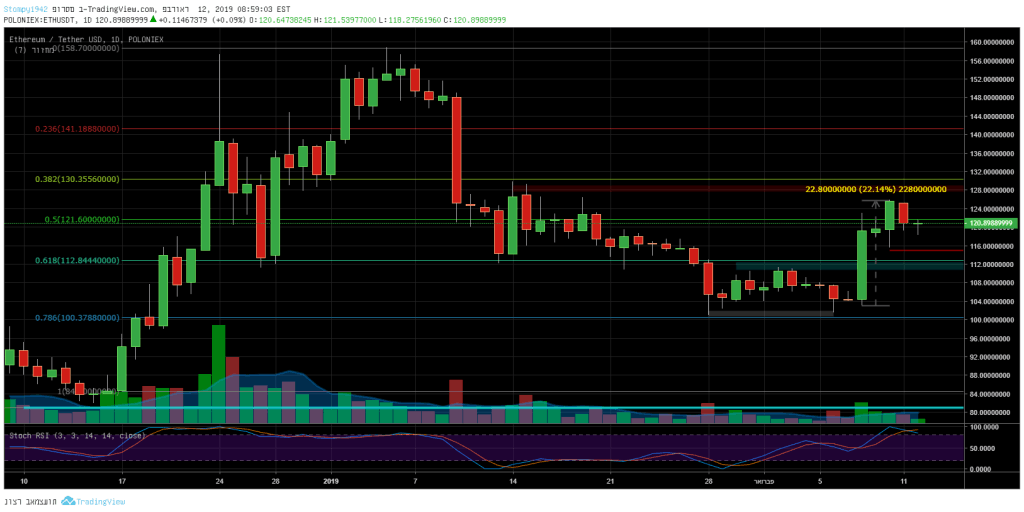
Against the dollar, the price is around Fibonacci levels. If we look at the Fibonacci since the rise in December, till the January correction, we can identify a move that has raised the price by 22%. Support around $100 held up, and resistance at $110 broke-up and now facing resistance level at $130. Support lies around $115.
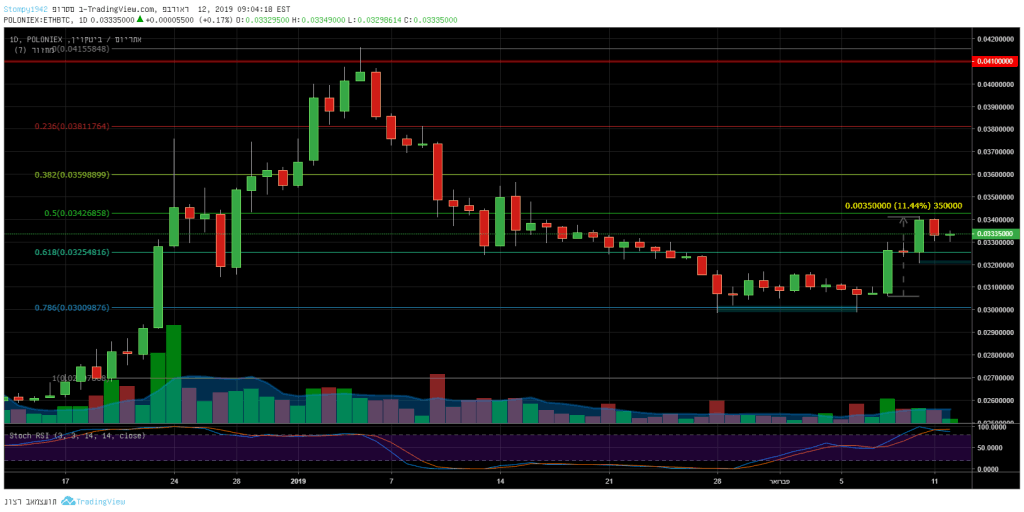
Against Bitcoin, there was an 11% rise in the last week. Resistance at 0.033BTC was easily breached, to face the next resistance at 0.035 BTC. The last is a critical area if we look at attempts to break above before the next levels of ETH around 0.041BTC. Fibonacci levels maintain support around 0.032BTC.
Ripple XRP
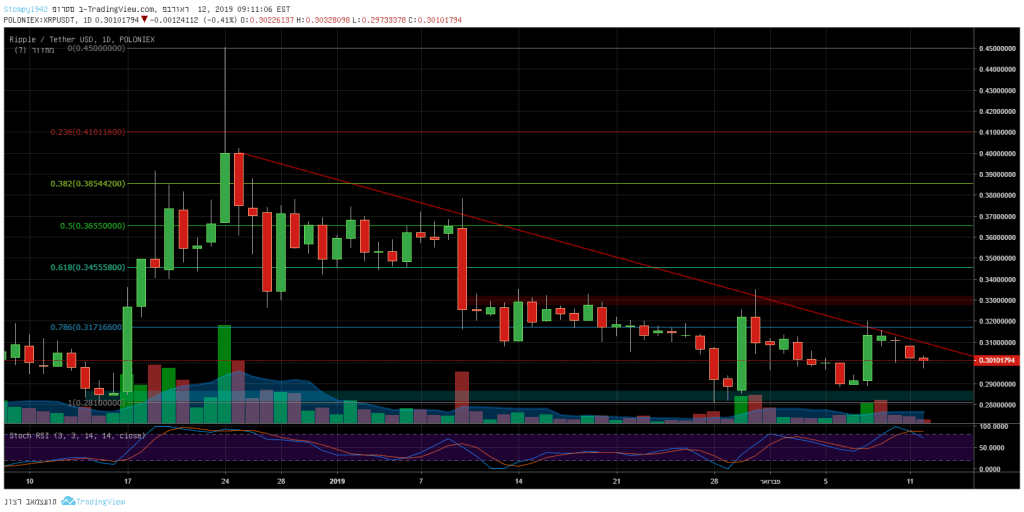
Against the dollar, this is the third time since December that the support around $0.28 is being tested. Resistance in this range lies at $0.32.
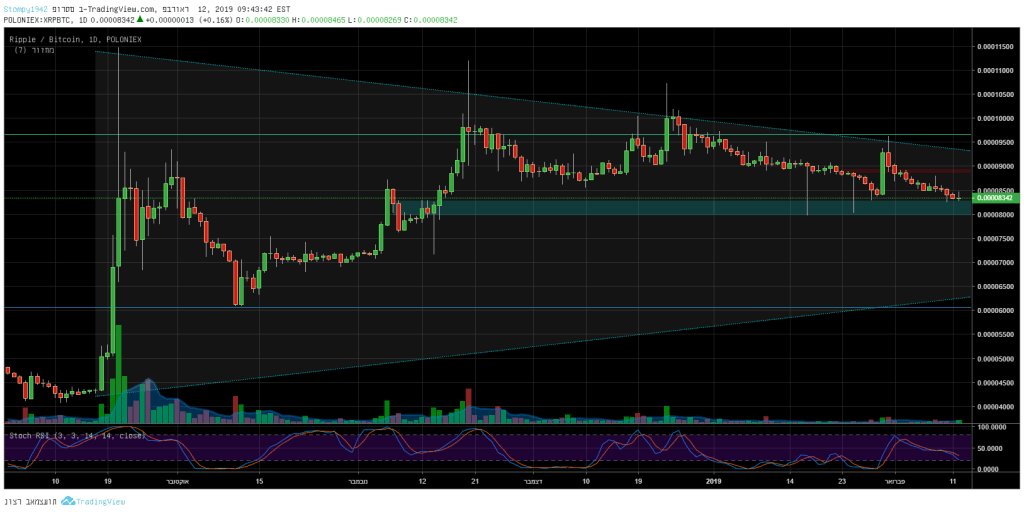
Against Bitcoin, the RSI is very low and the price is touching the support level that served as a critical area around September and November 2018. From there the price was detached from the bottom. Support lies around 8000 SAT, while resistance at 9000 SAT in this range.
Dash
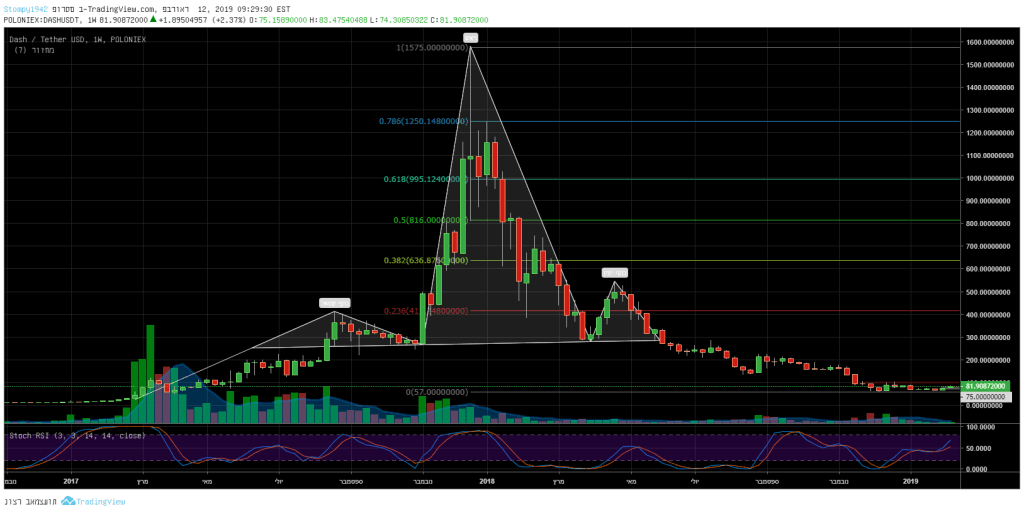
The weekly chart of January 2019 marked the most stable month of Dash, against the dollar, since February 2017. It should be noted that this amazing figure shows how the market calmed down.
The all-time high was at $1,575 and the all-time low at $57, this week the resistance broke up around $75, and we saw a 20% rise. As in many other altcoins, this may be the trend of the entire market, but in Dash’s case, it will change the balance of stability we have seen since the beginning of the year. We can expect to see whether the price continues the trend and breaks up the next resistance at $100.
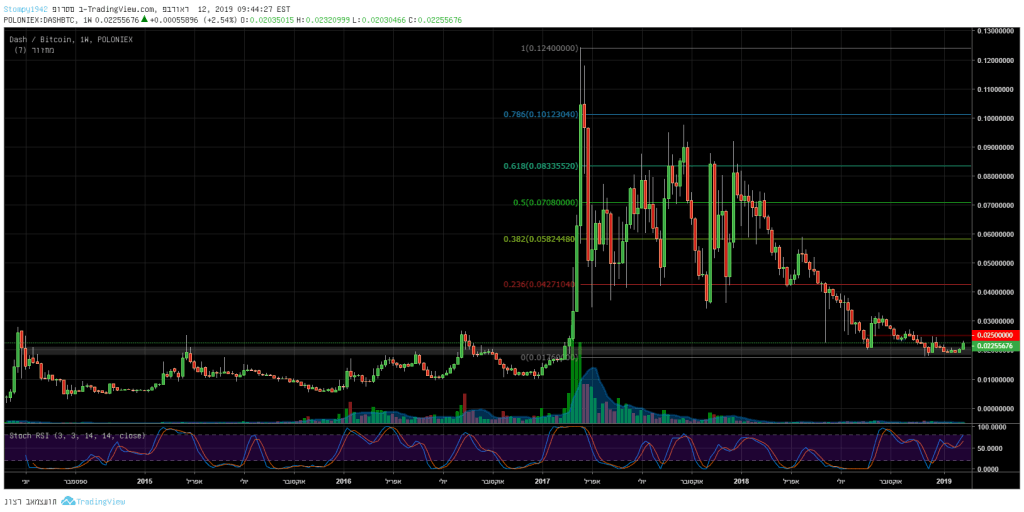
Against Bitcoin, it is trading slightly above the ranges that were hard to break before the major move in 2017. Dash is one of the altcoins that led the crypto-bubble we saw in 2017. Resistance in this range at 0.025BTC, whereas support is being built at 0.018 BTC.
Monero
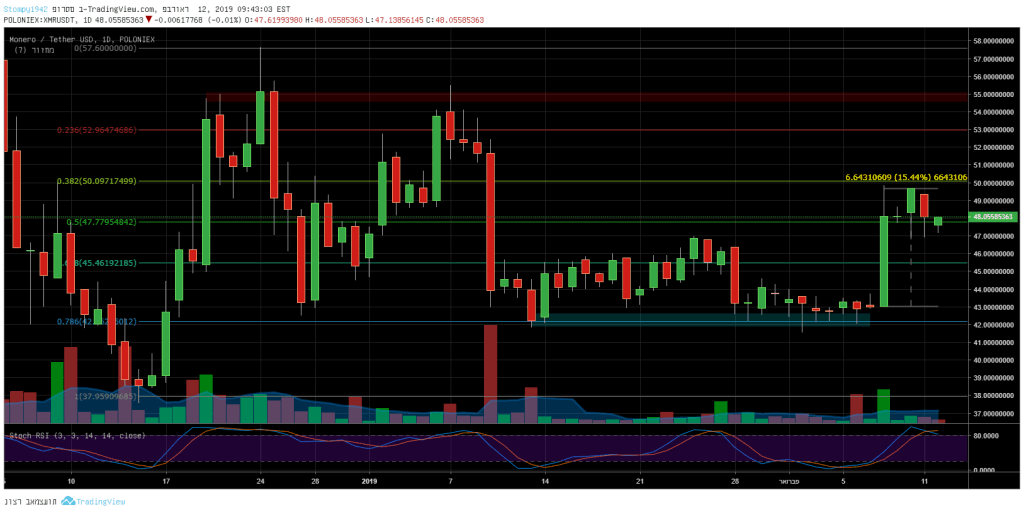
Against the dollar, XMR returned to a recently marked Fibonacci retracement. The support held around 0.786 Fib level until the price broke up, followed by a 15% rise this past week. Resistance lies at $50. Support at $47 holds whereas the next support is at the $40 – 45 zone.
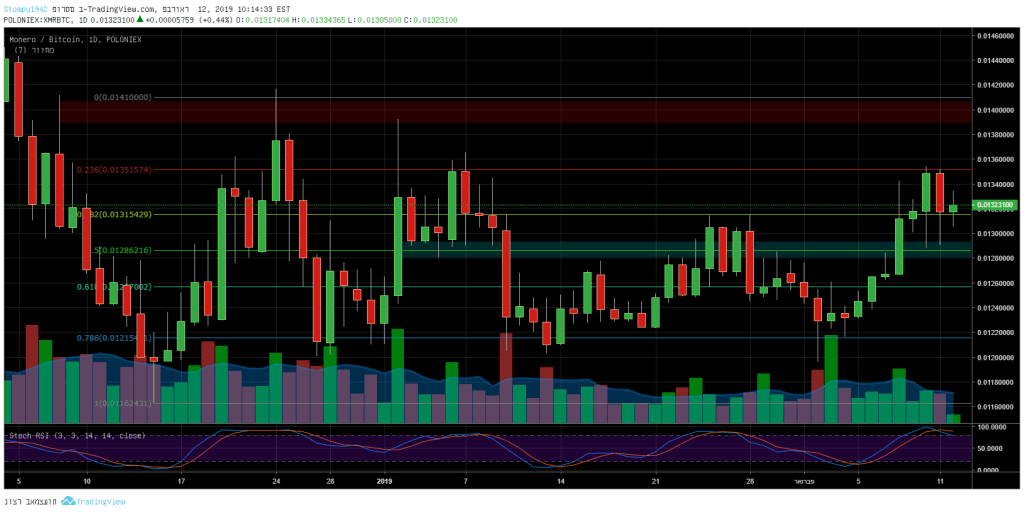
Against Bitcoin, XMR has had a volatile price range since the beginning of the year, ranging from 0.012BTC to 0.0135BTC, where resistance is currently nearby. Support this range around 0.025BTC.
The post Weekly Price Analysis Overview Feb.12: Bitcoin, Ethereum, Ripple, Dash and Monero appeared first on CryptoPotato.