We Will Never See Bitcoin Price Below $20,000, Explains Willy Woo
Popular on-chain analyst Willy Woo believes that bitcoin’s latest rally is here to stay as the asset will not drop beneath $20,000 again.
At the same time, more data comparing BTC’s behavior in previous rallies concluded that retail investors have not arrived yet but the cryptocurrency may already be in a liquidity crisis.
Bitcoin Won’t Go Down Below $20K?
It’s safe to say that bitcoin has been on a roll since Q4 2020. The primary cryptocurrency dabbled with the $10,000 level in late September but started accelerating rapidly as of October.
The continuous price increases led to painting a new 2020 high, a fresh all-time high, and breaking above the coveted $20,000 level for the first time.
However, BTC refused to show any signs of slowing down and kept surging in value once it reached uncharted territory. This led to multiple consecutive records, taking down milestone after milestone, and the latest all-time high came today – on bitcoin’s 12th birthday, at nearly $35,000.
Naturally, these developments brought excitement within the cryptocurrency community. Numerous members began offering their views on how far BTC can go up or what’s the worst possible scenario if it reverses.
Willy Woo, one of the most popular cryptocurrency analysts, reiterated his bullish sentiment. In a recent tweet, he asserted that bitcoin will not drop below $20,000. In fact, he believes that only a black swan event, similarly to the COVID-19-prompted liquidity crisis in mid-March, would drive BTC beneath the support level at $24,000.
We’ll never see $20k BTC again.
$24k support would need a black swan event to breakdown.
Floor price supported by long term buyers is rising very fast.
— Willy Woo (@woonomic) January 3, 2021
2013 Vs. 2017 Vs. 2020 Runs: Find The Differences
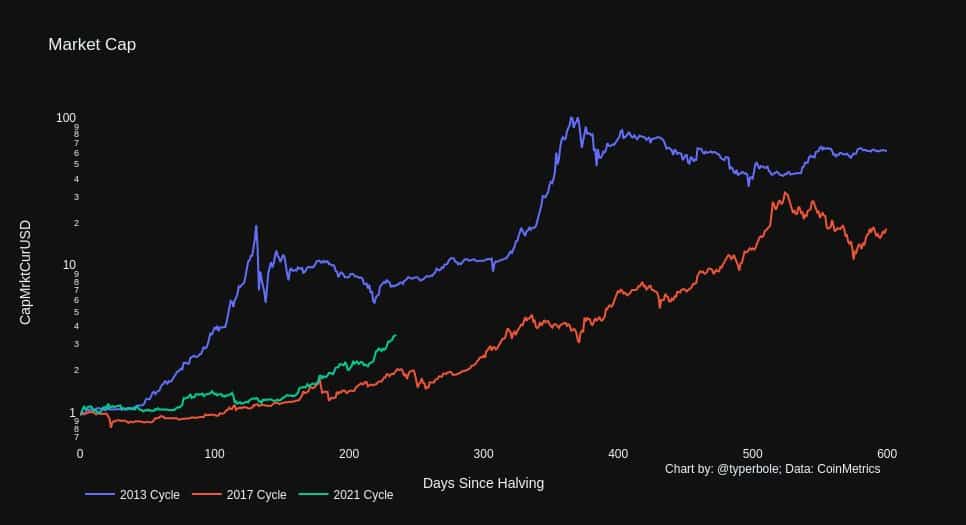
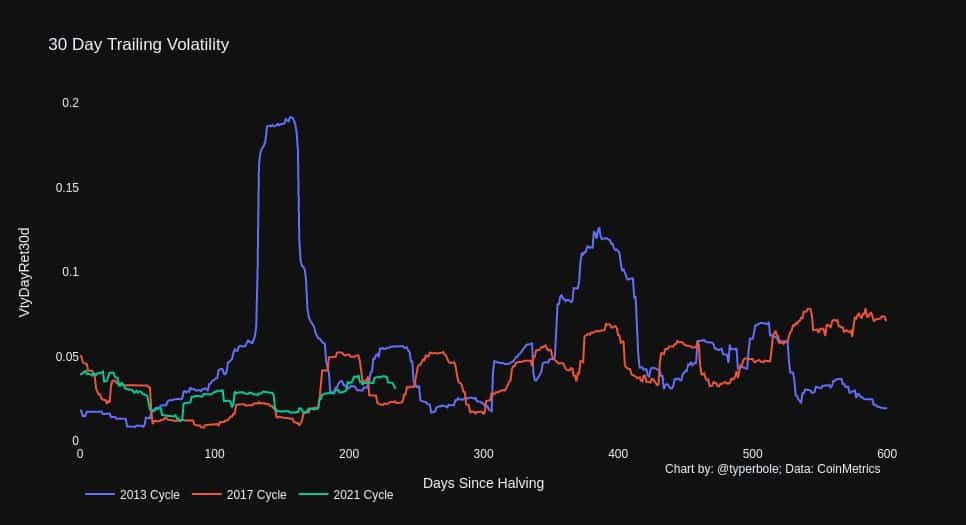
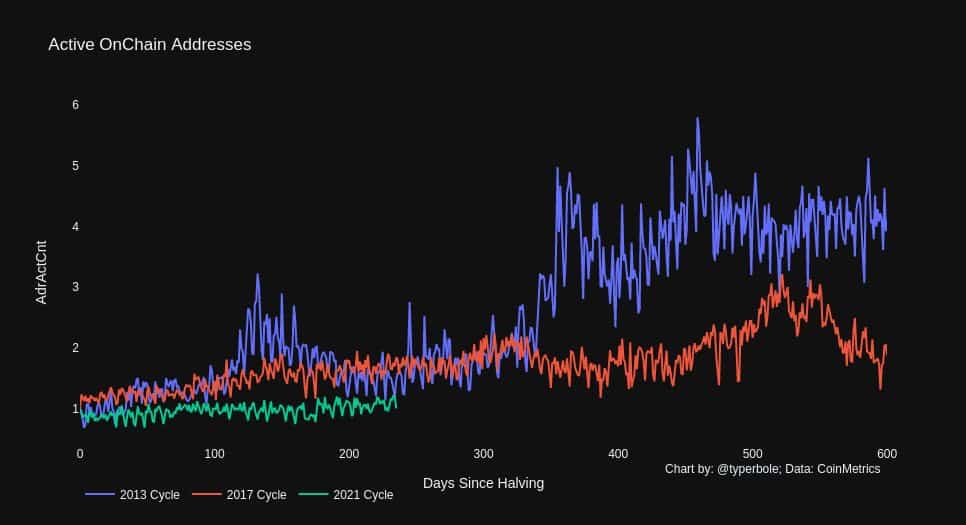
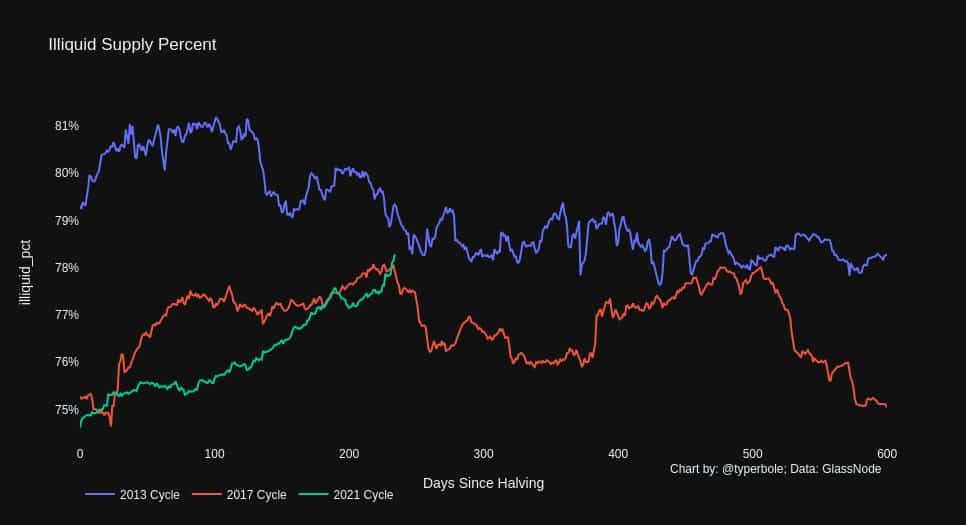
A different on-chain analyst explored the major similarities and differences between the three most notable bull runs in bitcoin’s history – 2013, 2017, and the current 2020-2021. More specifically, he examined their relation with the BTC halving that took place prior to each rally.
The strategist said that the current cycle started about 150 days after the 2020 halving. In comparison, the so-called “inflection point” in 2017 came 250 days after the event, while for 2013 was just 50 days.
Although bitcoin’s market cap recently surged above $600 billion for the first time, the graph below demonstrates that there’s still a long way to go to reach the 2013 and 2017 records in terms of rapid increases.

When it came down to the infamous bitcoin volatility, the analyst noted that the asset’s current performance is very similar to the 2017 data while being far behind the 2013 stats. Moreover, he said that “so far we haven’t really experienced much volatility to the downside” during the latest rally.

Retail Investors And Liquidity
The strategist’s views supported a recent narrative that retail investors have been absent during the 2020/2021 bull cycle. CryptoPotato reported earlier that bitcoin searches on Google, typically a good indicator of retail investors’ behavior, have spiked to yearly highs. However, they are still a long way down compared to 2017.
The analyst explored the active on-chain addresses, which suggest that retail investors were the most active during the 2013 rally.
“This is consistent with the hypothesis that retail has not arrived en masse yet, and this rally is being driven by a smaller set of early-adopting institutions and high-net-worth individuals (HNWI).”

According to a recent report that reflected the large number of institutions purchasing BTC, all lost or locked coins, whales’ HODLing mentality, and miners’ unspent supply, the cryptocurrency is in an ongoing liquidity crisis.
The analyst also looked into this topic and concluded that the “illiquid supply is rocketing up at an increasing rate.” It has already breached above the 2017 performance and aims to overcome the 2013 run as well.
“Previous cycles reached peak illiquidity earlier, then gradually declined as coins moved back from cold storage to be sold. We haven’t reached peak illiquidity yet, and the upwards trajectory shows no signs of abating.” – he added.


