WazirX Price Analysis: WRX Facing Critical Resistance At $0.1 But Can It Break Through?
- After a 25% daily surge, WazirX continued to struggle under key resistance across trading pairs
- WazirX is looking for a strong rebound level to keep the buyers in action.
- Despite the latest bullish price actions, the WRX market still favors the short-term bears
WRX/USD: WazirX Suspends Bearish For Sideways
Key Resistance Levels: $0.1, $0.15
Key Support Levels: $0.063, $0.053

Following the recent global market crisis, we saw how most of the altcoins fell to a new low, including WazirX, which has now found temporary support around $0.53 against the US Dollar.
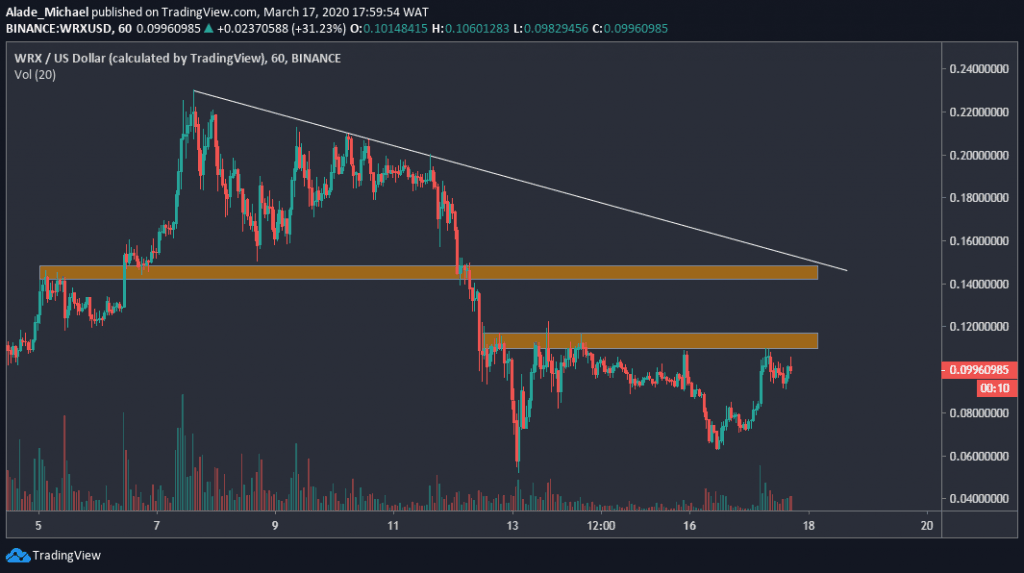
After an excellent 5-day recovery, WazirX is now trading around $0.099, with 22.31% gains over the past few hours. Meanwhile, the bearish sentiment has been technically suspended to a sideways trend.
WRX has faced major resistance around $0.1-$0.11 price areas since the market pulled back last Thursday, which means the bears are still present in the market. We can expect to see a small increase to the white regression line once the buyers clear this crucial resistance.
If not, the sellers are likely to resume pressure in the market. As of now, WazirX is still neutral-bearish on the hourly chart.
WazirX Short-Term Price Analysis
Bulls are finding it challenging to break above the immediate orange area of $0.1 resistance. If they succeed, we can consider the next resistance to be around $0.15, which is the second orange spot on the price chart.
Above this level lies $0.20 and $0.23 resistance, from where the market reversed earlier this month.
As long as the price stays under the $0.1 resistance, WazirX would continue to hold essential support at $0.06, which is this week’s low and the $0.04 (last week’s low). If the price falls below these supports, we may see another huge selling in this market.
WRX/BTC: WRX Looking For Rebound Level
Key Resistance Levels: 2000 SAT, 2500 SAT
Key Support Levels: 1600 SAT, 1400 SAT

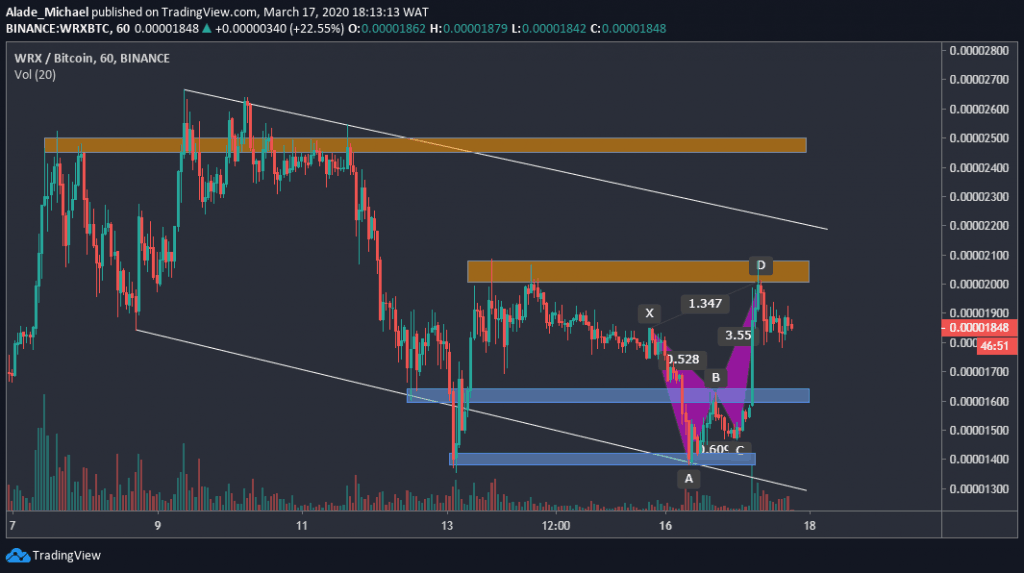
Against Bitcoin, WazirX is looking bearish but has been following a sideways trend for the past few days now. After opening around 1450 SAT today, WRX completed a XABCD harmonic pattern (bullish butterfly) to reach the 2000 SAT level.
Despite the slight drops to the 1845 SAT level, WazirX is still gaining 17.92% at the moment. For more bullish momentum, we need to see a nice pullback to 1600 SAT level, labeled B on the harmonic pattern.
This pullback may lead to bearish continuation if the blue demand area fails to hold. However, the price of WRX is still shaping inside two weeks descending channel, which shows that sellers are still in control.
We can expect the bulls to take over if the price breaks above the channel. For now, WazirX is bearish on a short-term trend.
WazirX Short-Term Price Analysis
WazirX is currently undergoing a consolidation. On the upside, there’s a close resistance around the 2000 SAT level (the first orange area on the hourly chart). If the price climbs higher and breaks above the channel, the second orange resistance of 2500 SAT would be the next bulls’ target.
As mentioned above, on the downside, the 16000 SAT support is a rebound level for the buyers.
If the level fails to provide support, the price may continue to drop towards the 1400 SAT support level, which is the monthly low. If it breaks, a fresh monthly low may form around 12000 -1000 SAT price area.
The post WazirX Price Analysis: WRX Facing Critical Resistance At $0.1 But Can It Break Through? appeared first on CryptoPotato.


