Want to Track the Speculative Frenzy in Bitcoin Market, Here’s How
/arc-photo-coindesk/arc2-prod/public/LXF2COBSKBCNHNRE3WTK2BZ7GE.png)
-
The spread between next-month and front-month bitcoin futures contracts can offer insights into the level of speculation in the market, one analyst.
-
An above $1,000 spread on the CME has marked previous bull market tops. The spread recently widened beyond $1,000.
Speculative frenzy, or periods of intense speculation characterized by irrational exuberance and greed, is an infamous sign of an impending market top.
However, tracking signs of speculative frenzy in the bitcoin (BTC) market requires access to and understanding of sophisticated indicators like perpetual funding rates and social trends. But there is another surprisingly more straightforward way: tracking the spread or difference between prices for next-month and front-month futures contracts trading on major exchanges like the Chicago Mercantile Exchange and Deribit.
The “front-month contract” has an expiration date closest to the current date. The contract expiring in two months is called the next-month contract.
The futures term structure is usually upward sloping, as contracts with a more extended expiry time trade at a premium to short-duration ones. That said, when the spread becomes too large, it’s a good indicator of speculative sentiment, according to Griffin Ardern, head of options trading and research at crypto financial platform BloFin.
“Usually, when the spread between the next months and the front months is large, investors’ speculation sentiment is high, and they are willing to pay higher costs to hold long positions,” Ardern told CoinDesk. “You can find clues into Deribit’s term structure.”
The same applies to CME’s standard futures contracts, sized at 5 BTC and considered a proxy for institutional activity.
The spread between the CME-listed next- and front-month contracts widened beyond $1,000 in late February 2021 and mid-October 2021, signaling speculative frenzy and presaging bull market peaks by a few weeks. In other words, the wider spread was a sign the bull market was in its final stages.

We saw a similar spike above $1,000 early this month, indicating caution to bitcoin bulls. As the saying goes, once is an accident, twice is a coincidence, and three times is a pattern.
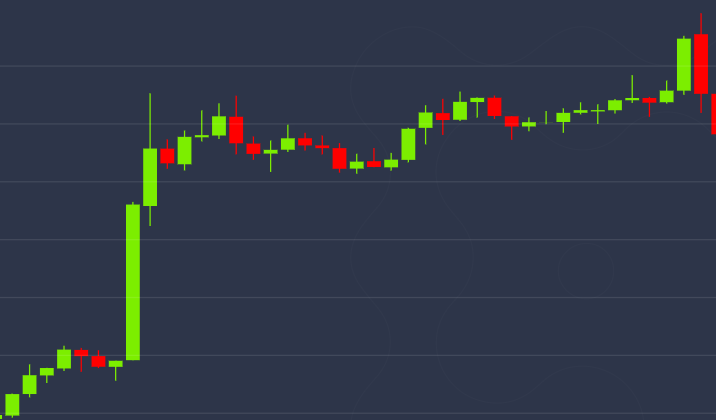
Bitcoin changed hands at $$67,290 at press time, up 10% from lows under $61,000 reached Wednesday, according to CoinDesk data. The cryptocurrency hit a record high of $73,798 on March 14.
Edited by Parikshit Mishra.


