Volatility Incoming for ETH Following Consolidation Around $1.8K? (Ethereum Price Analysis)
Technical Analysis
By Shayan
Ethereum’s recent market activity has introduced a sense of uncertainty, with the price consolidating within a narrow range and lacking a clear direction. The situation becomes pivotal if the price manages to surpass the 200-day moving average, indicating the potential for a significant surge.
The Daily Chart
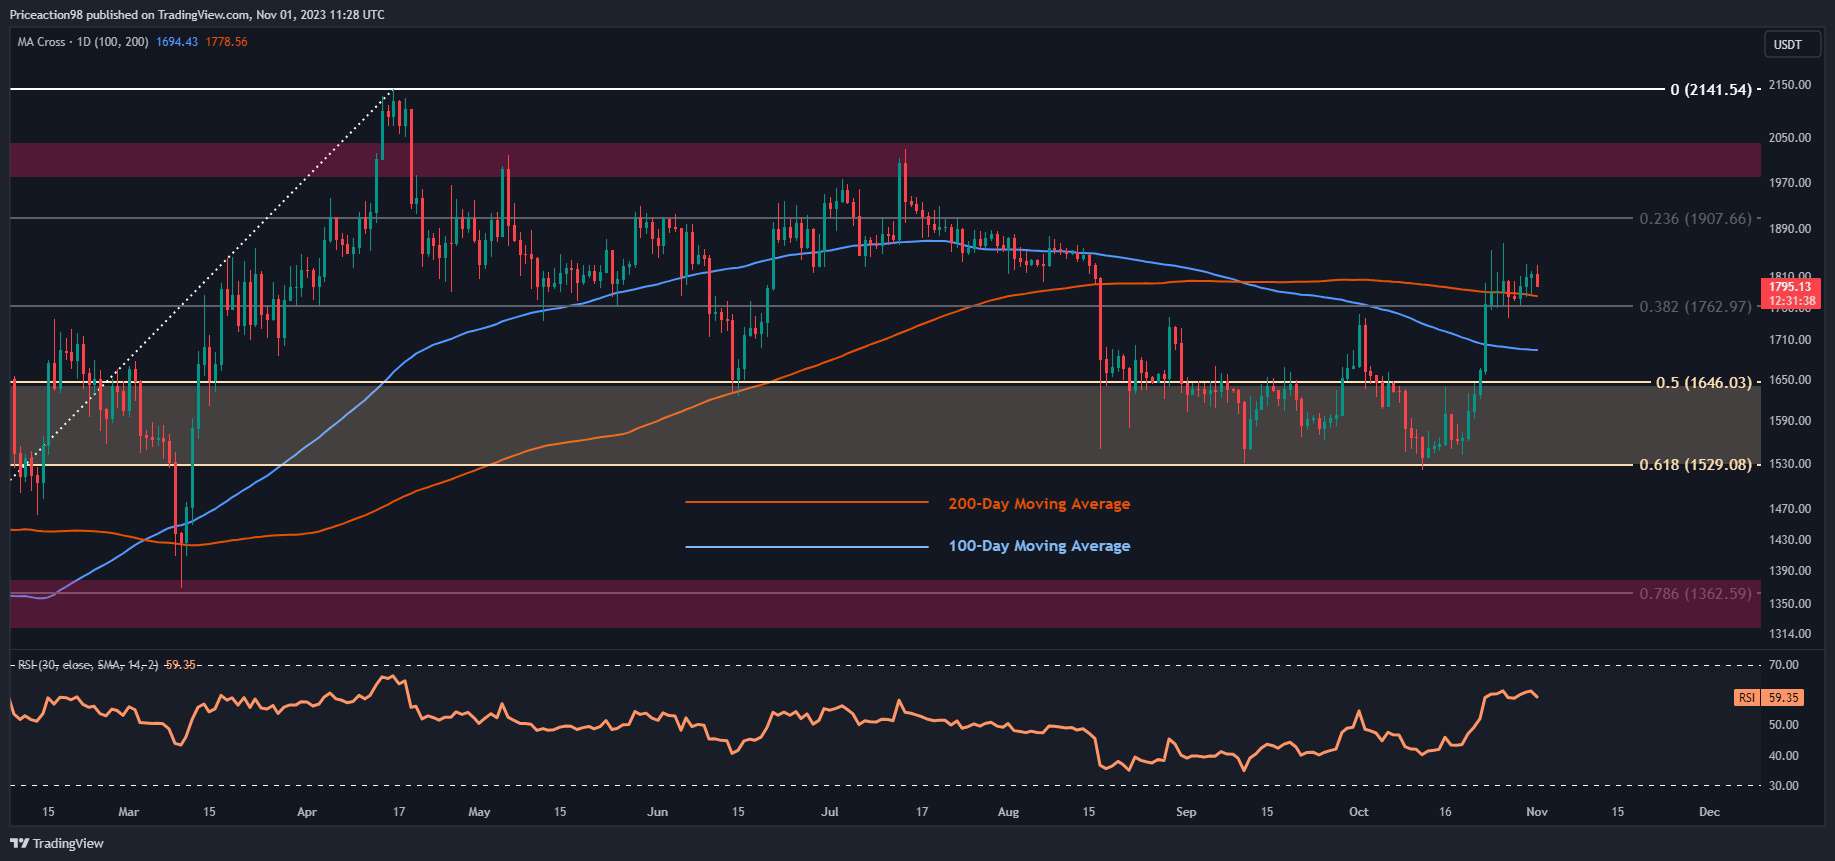
Examining the daily chart, Ethereum encountered a substantial resistance zone at the 200-day moving average, positioned at $1.8K. This led to a sideways consolidation phase marked by slight volatility. This range holds immense importance due to its psychological significance and the existing supply dynamics.
Ethereum’s lack of decisive movement in either direction creates anticipation, with a breakout or rejection likely determining its mid-term trajectory. A successful breakout above this level could trigger a robust uptrend, targeting the firm resistance at $2K, while a rejection could result in a short-term decline towards the 100-day moving average, situated at $1.7K.
The 4-Hour Chart
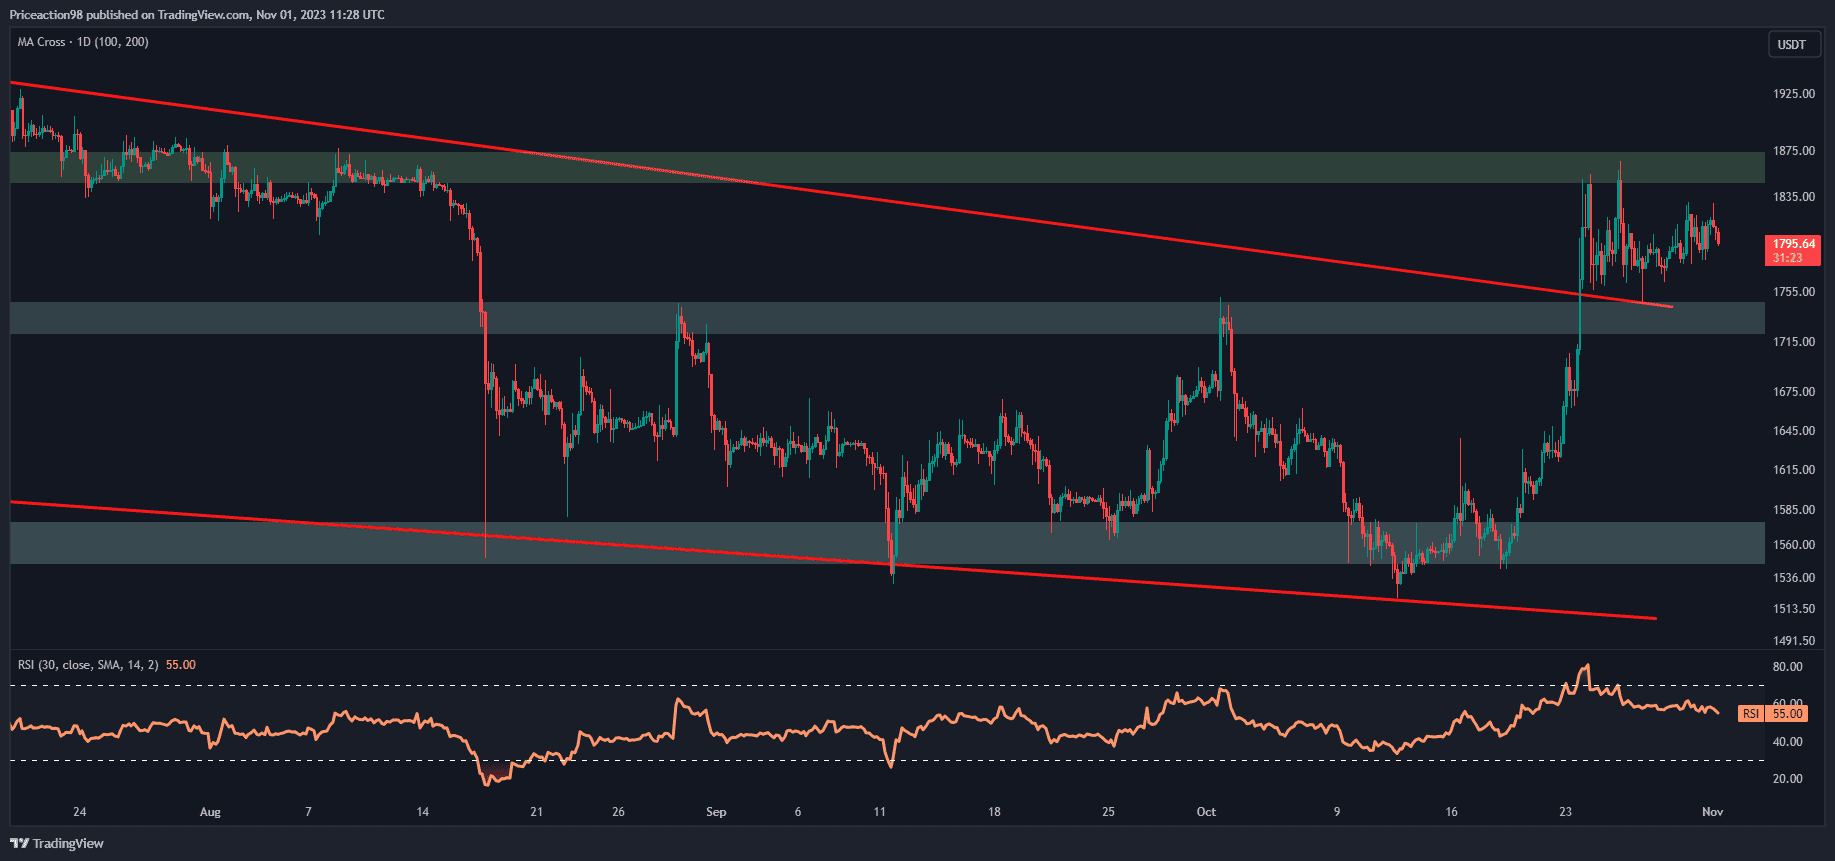
The 4-hour chart reveals heightened volatility and a consistent uptick in demand, evident in Ethereum’s recent price action. However, when attempting to breach the critical resistance zone of $1.8K, the price encountered increased supply, resulting in a period of sideways movement.
Furthermore, Ethereum appears confined within a pivotal range, bordered by the static support area at $1.7K and the significant resistance at $1.8K.
A breakout from this range is essential to unveil Ethereum’s subsequent direction. Given the current market scenario, there is a high likelihood of a prolonged consolidation correction phase in the short term. This suggests that the market might continue its sideways movement before definitively determining its next course of action.
On-chain Analysis
By Shayan
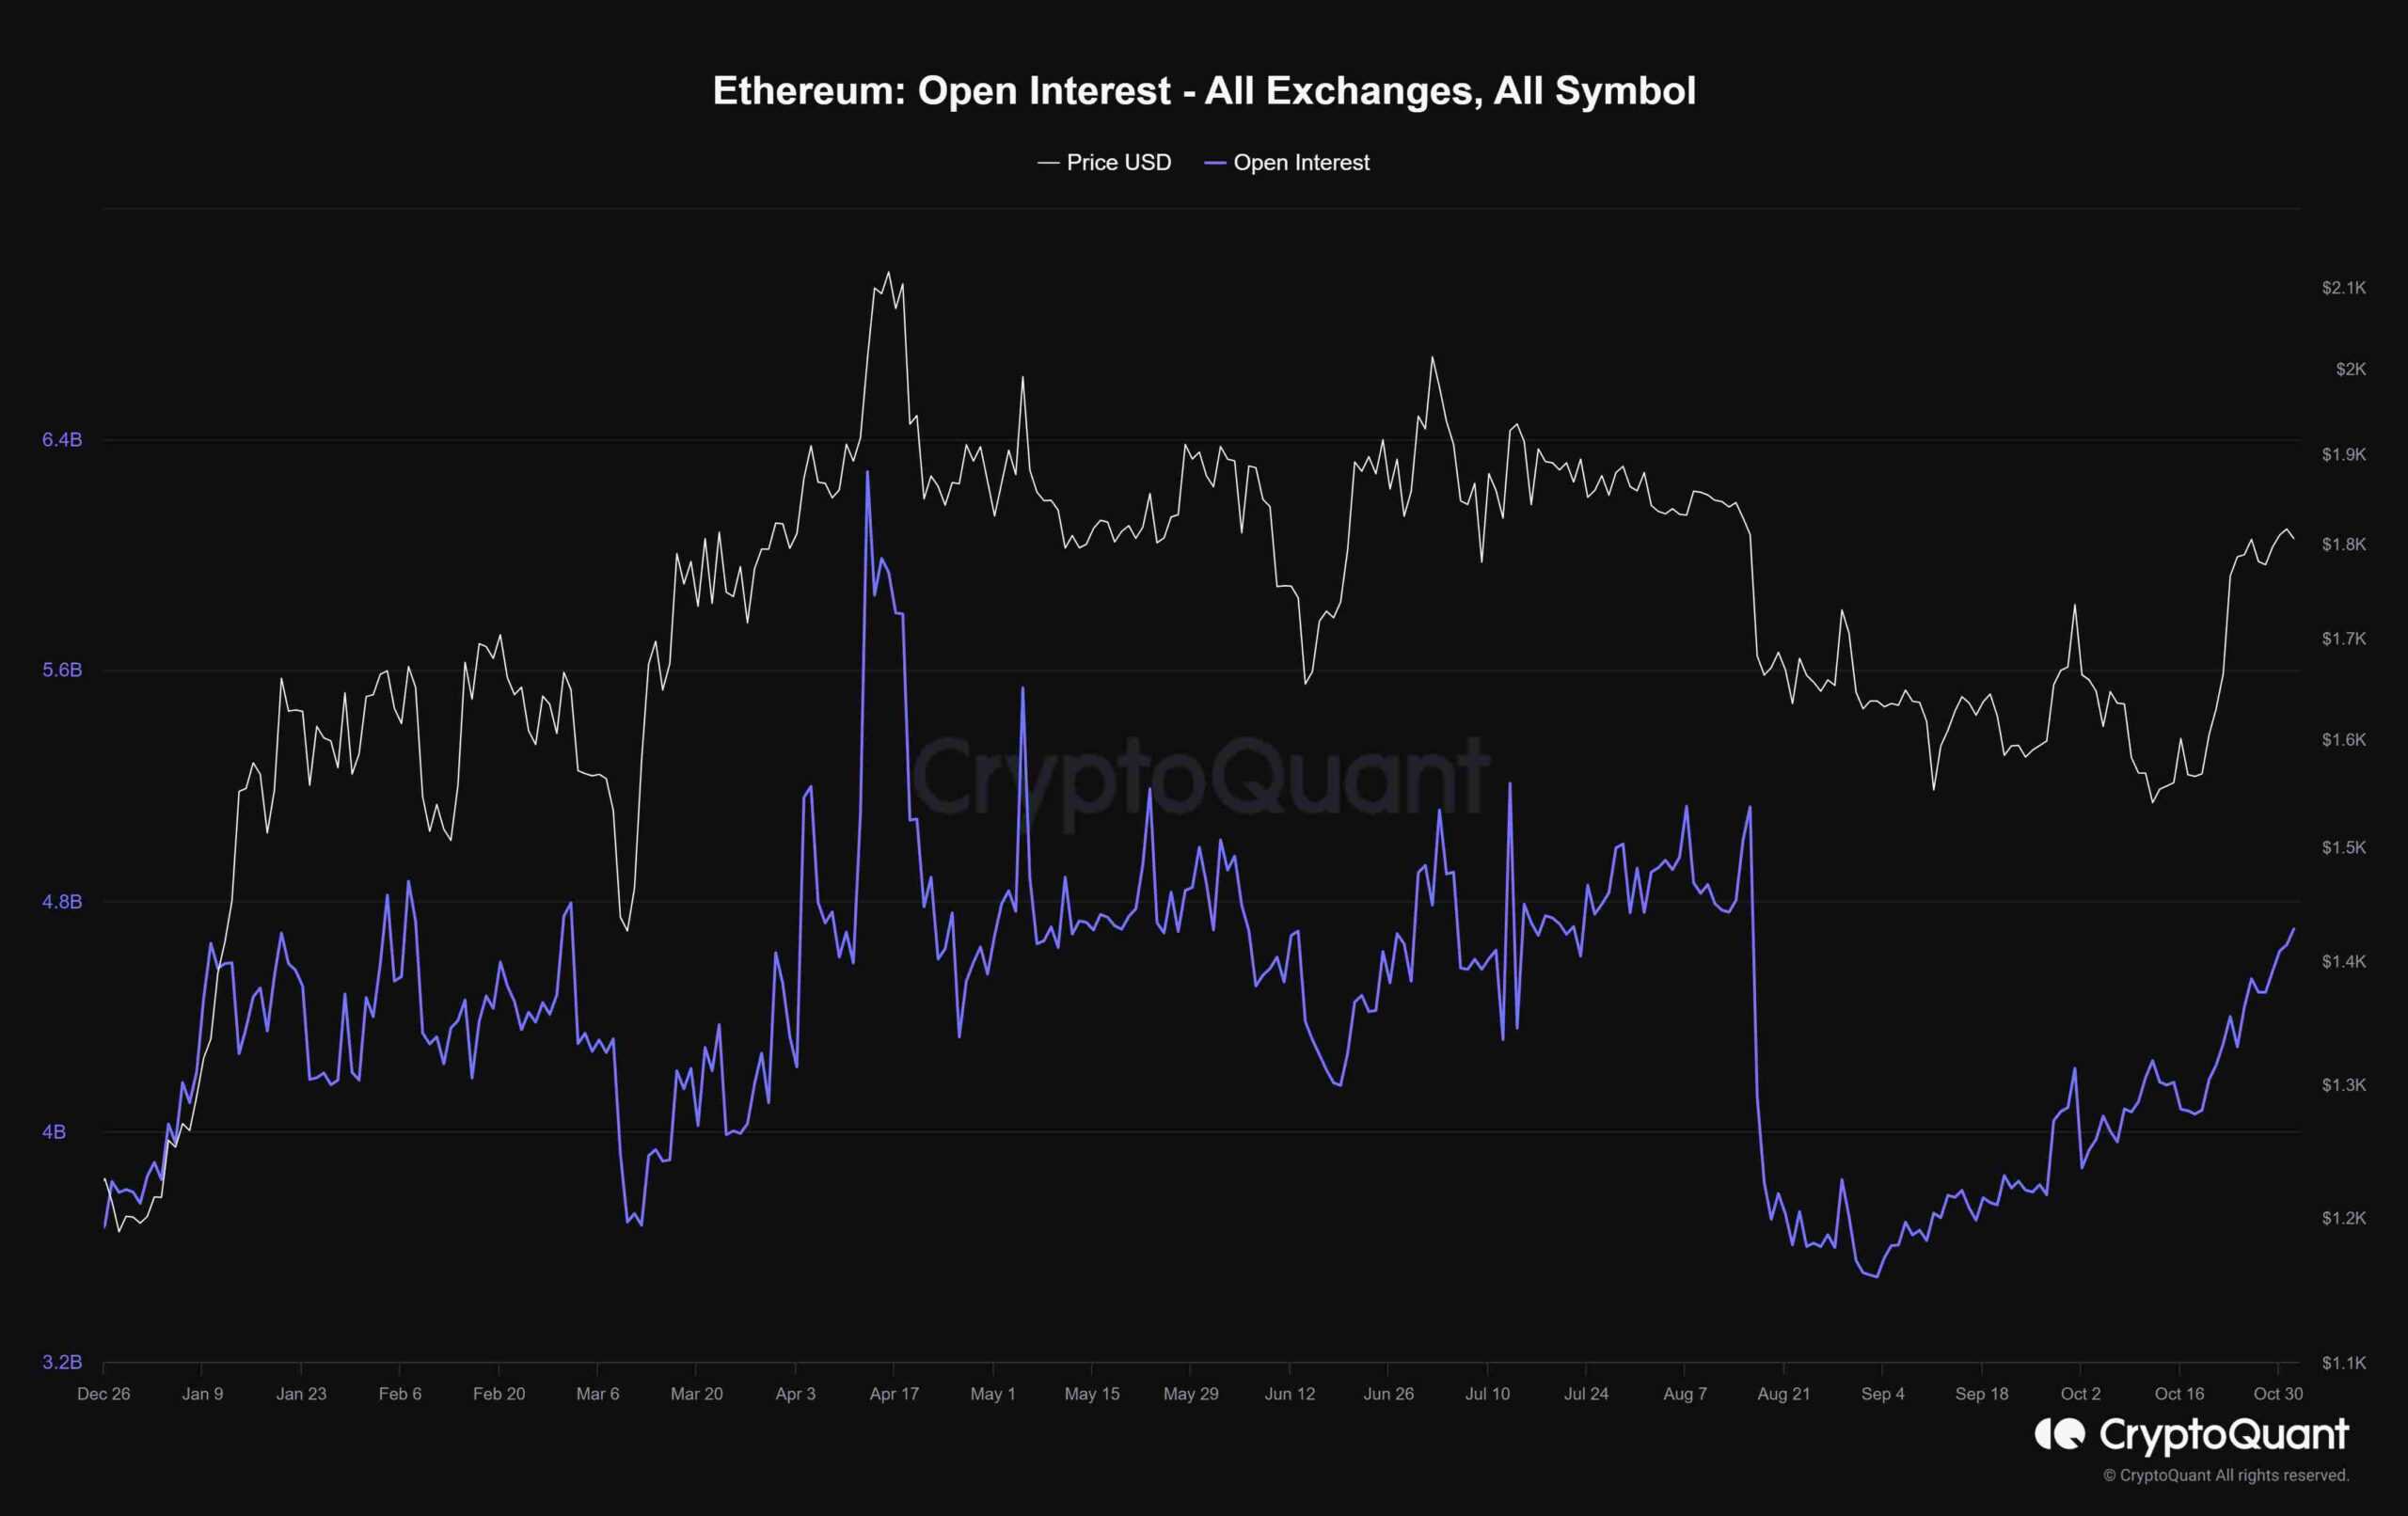
Ethereum’s price recently experienced a notable surge after a period of consolidation, catching the attention of investors and traders, especially those active in the speculative perpetual futures market.
Simultaneously, the open interest metric, indicating the number of active futures positions, has witnessed an uptrend, reaching its prior high. This suggests the possibility of increased market volatility as both long and short positions face a higher risk of liquidation.
This situation implies a likelihood of a continued upward trend in the medium term, given that the futures market has not yet reached an overheated state. However, it’s crucial to note that the market still can experience a retracement, and the potential uptrend might be accompanied by heightened volatility, leading to abrupt and substantial price fluctuations.
The post Volatility Incoming for ETH Following Consolidation Around $1.8K? (Ethereum Price Analysis) appeared first on CryptoPotato.