US Tops Global Stablecoin Buys Amidst Crypto Winter to Spring Transition
The industry has displayed several signs of recovery after a tumultuous crypto winter. Although Bitcoin and other major cryptocurrencies have received significant attention, stablecoins have also outpaced other asset types in terms of usage, accounting for more than half of all transaction volume in recent months.
Chainalysis’ latest data suggests that stablecoins are becoming a true global asset.
United States Leads Stablecoin Purchases
The 2024 Crypto Spring report by Chainalysis reveals a significant surge in global demand for stablecoins. The United States led in purchases while witnessing increasing contributions from diverse nations and regions, totaling over $30 billion in January 2024 alone.
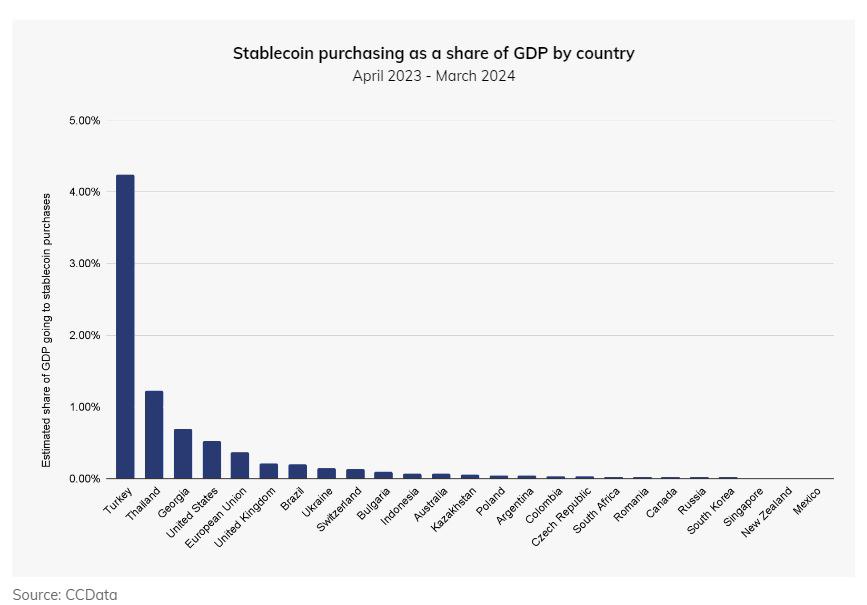
While the US and the EU maintain strong representation, emerging markets such as Thailand, Brazil, and especially Turkey stand out regarding stablecoin purchasing as a share of national GDP.
This international interest essentially highlighted a growing reliance on stablecoins like USDT across various regions, particularly in nations experiencing local currency volatility and devaluation, such as Turkey and Georgia. Residents in these countries frequently turn to stablecoins as a means to safeguard their savings amid currency fluctuations, according to insights from industry experts shared with Chainalysis.

Zooming out, Chainalysis also found that the transfer activity during the recent market surge has surpassed the previous highs observed in late 2020 and 2021. This was indicative of the prevailing sentiment that this market cycle has been considerably more active than the last bull run, and such an accelerated growth rate compared to past cycles may indicate increased market confidence.
Further validating this trend is the number of wallets with a positive balance continues to grow steadily, with over 400 million wallets actively holding cryptocurrency. While one wallet doesn’t necessarily mean one user, as both institutions and individuals can have multiple wallets, the steady increase suggests a growing use of cryptocurrency.

Crypto Investment Sees First QoQ Rise Since 2023
Although crypto funding slowed down during the prolonged bear market, there was an increase in crypto investment in Q1 2024, marking the first quarter-over-quarter rise since Q1 2023. Median deal sizes have also rebounded from a steep decline in Q4 2022, staying consistently around the $10 million mark.
Moreover, Bloomberg recently reported that the crypto venture capital fund Paradigm is in discussions to raise between $750 and $850 million, potentially becoming the largest raise for a VC fund in the crypto industry since the market downturn in 2022.
Chainalysis also found that several major deals above $100 million, including early-stage investments, took place in Q3 2023 and continued into Q1 2024.
Notable deals during this period included Swan Bitcoin raising $165 million for asset management and tax purposes, Blockchain.com securing $100 million for its exchange platform, Wormhole receiving $225 million for bridges and interoperability solutions, Totter obtaining $101 million for open-source cloud storage services, together.ai raking in $225 million with a valuation of $2.5 billion for DePIN solutions, and EigenLayer amassing $100 million for developments in the Ethereum protocol.
The post US Tops Global Stablecoin Buys Amidst Crypto Winter to Spring Transition appeared first on CryptoPotato.


