Two Possible Scenarios for XRP Going Into This Week (Ripple Price Analysis)
Ripple has entered a consolidation stage, with the price slightly decreasing towards a significant support area encompassing the 100-day and 200-day moving averages.
This support zone is anticipated to impede further downward trends, propelling the price towards higher levels.
XRP Analysis
By Shayan
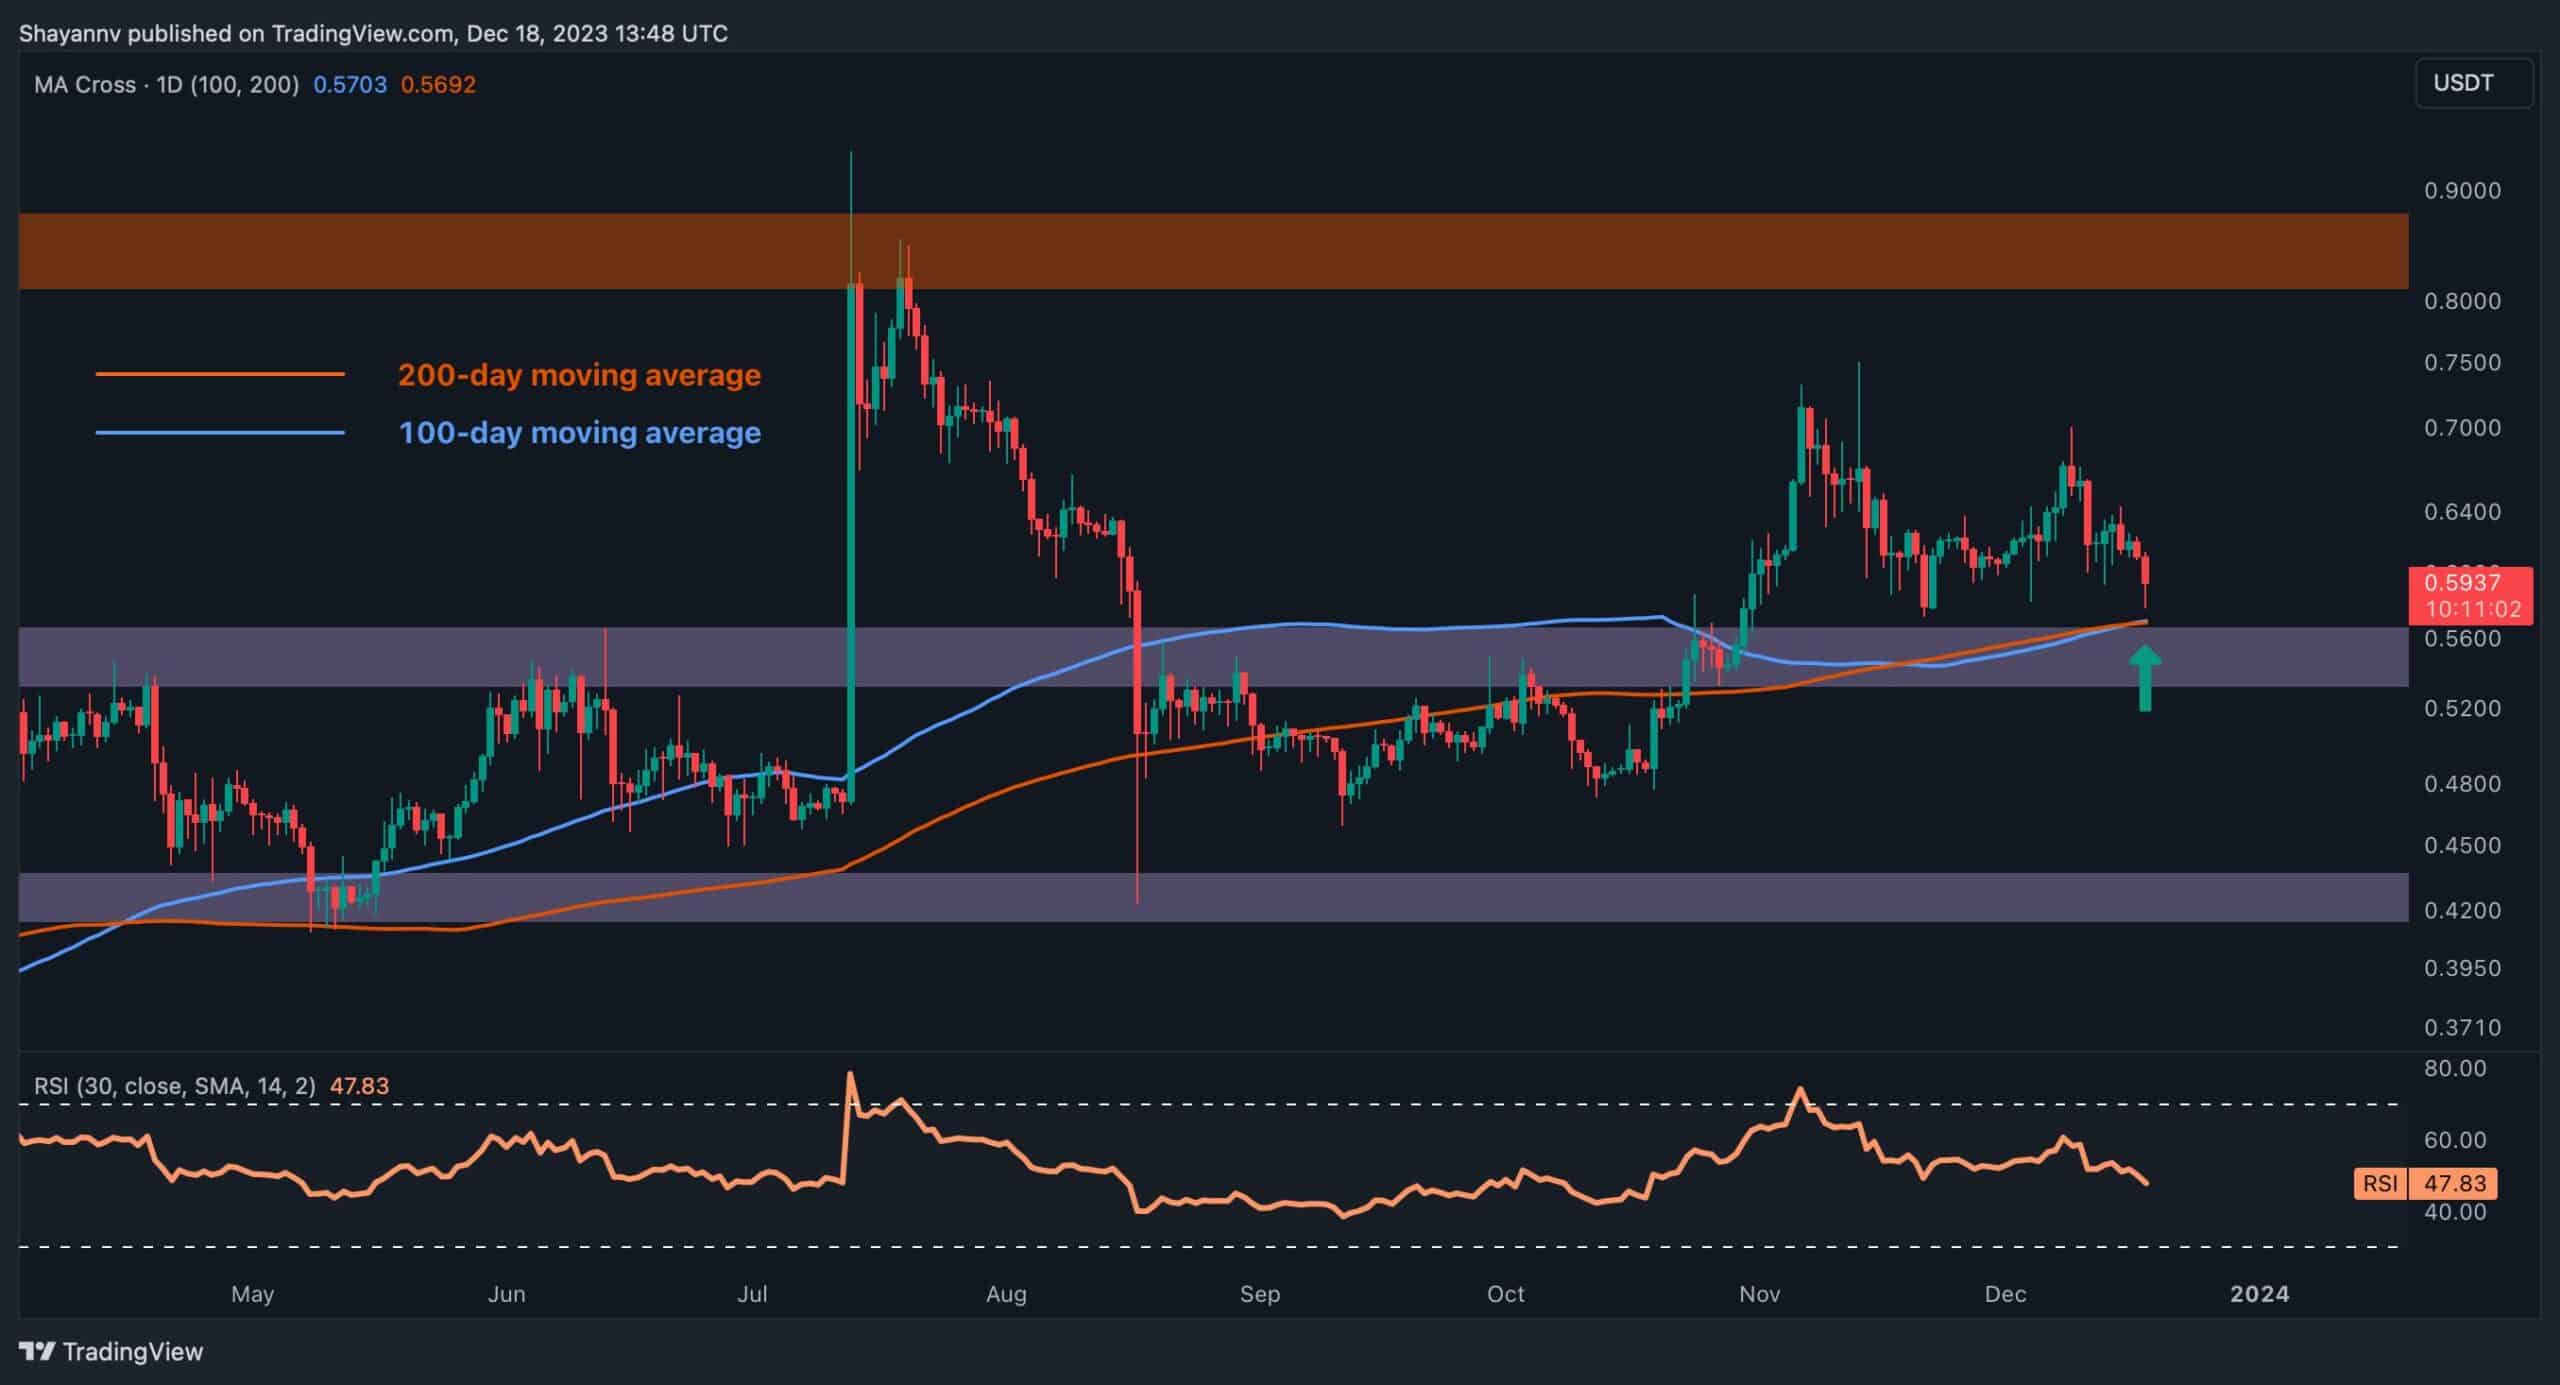
The Daily Chart
Upon closer examination of the daily chart, it is evident that Ripple’s consolidation phase has extended, characterized by low volatility and a gradual decline toward a crucial support region. This critical range includes the 100-day and 200-day moving averages, in addition to the psychological support level of $0.56, offering substantial backing for Ripple.
Given the prevalent buying pressure and demand around this pivotal level, Ripple is expected to find support, preventing further downward pressure. In this scenario, the price may undergo a consolidation period followed by a renewed bullish movement. Conversely, if sellers manage to push the price below this critical support, the market could experience a cascade effect, targeting lower price levels.
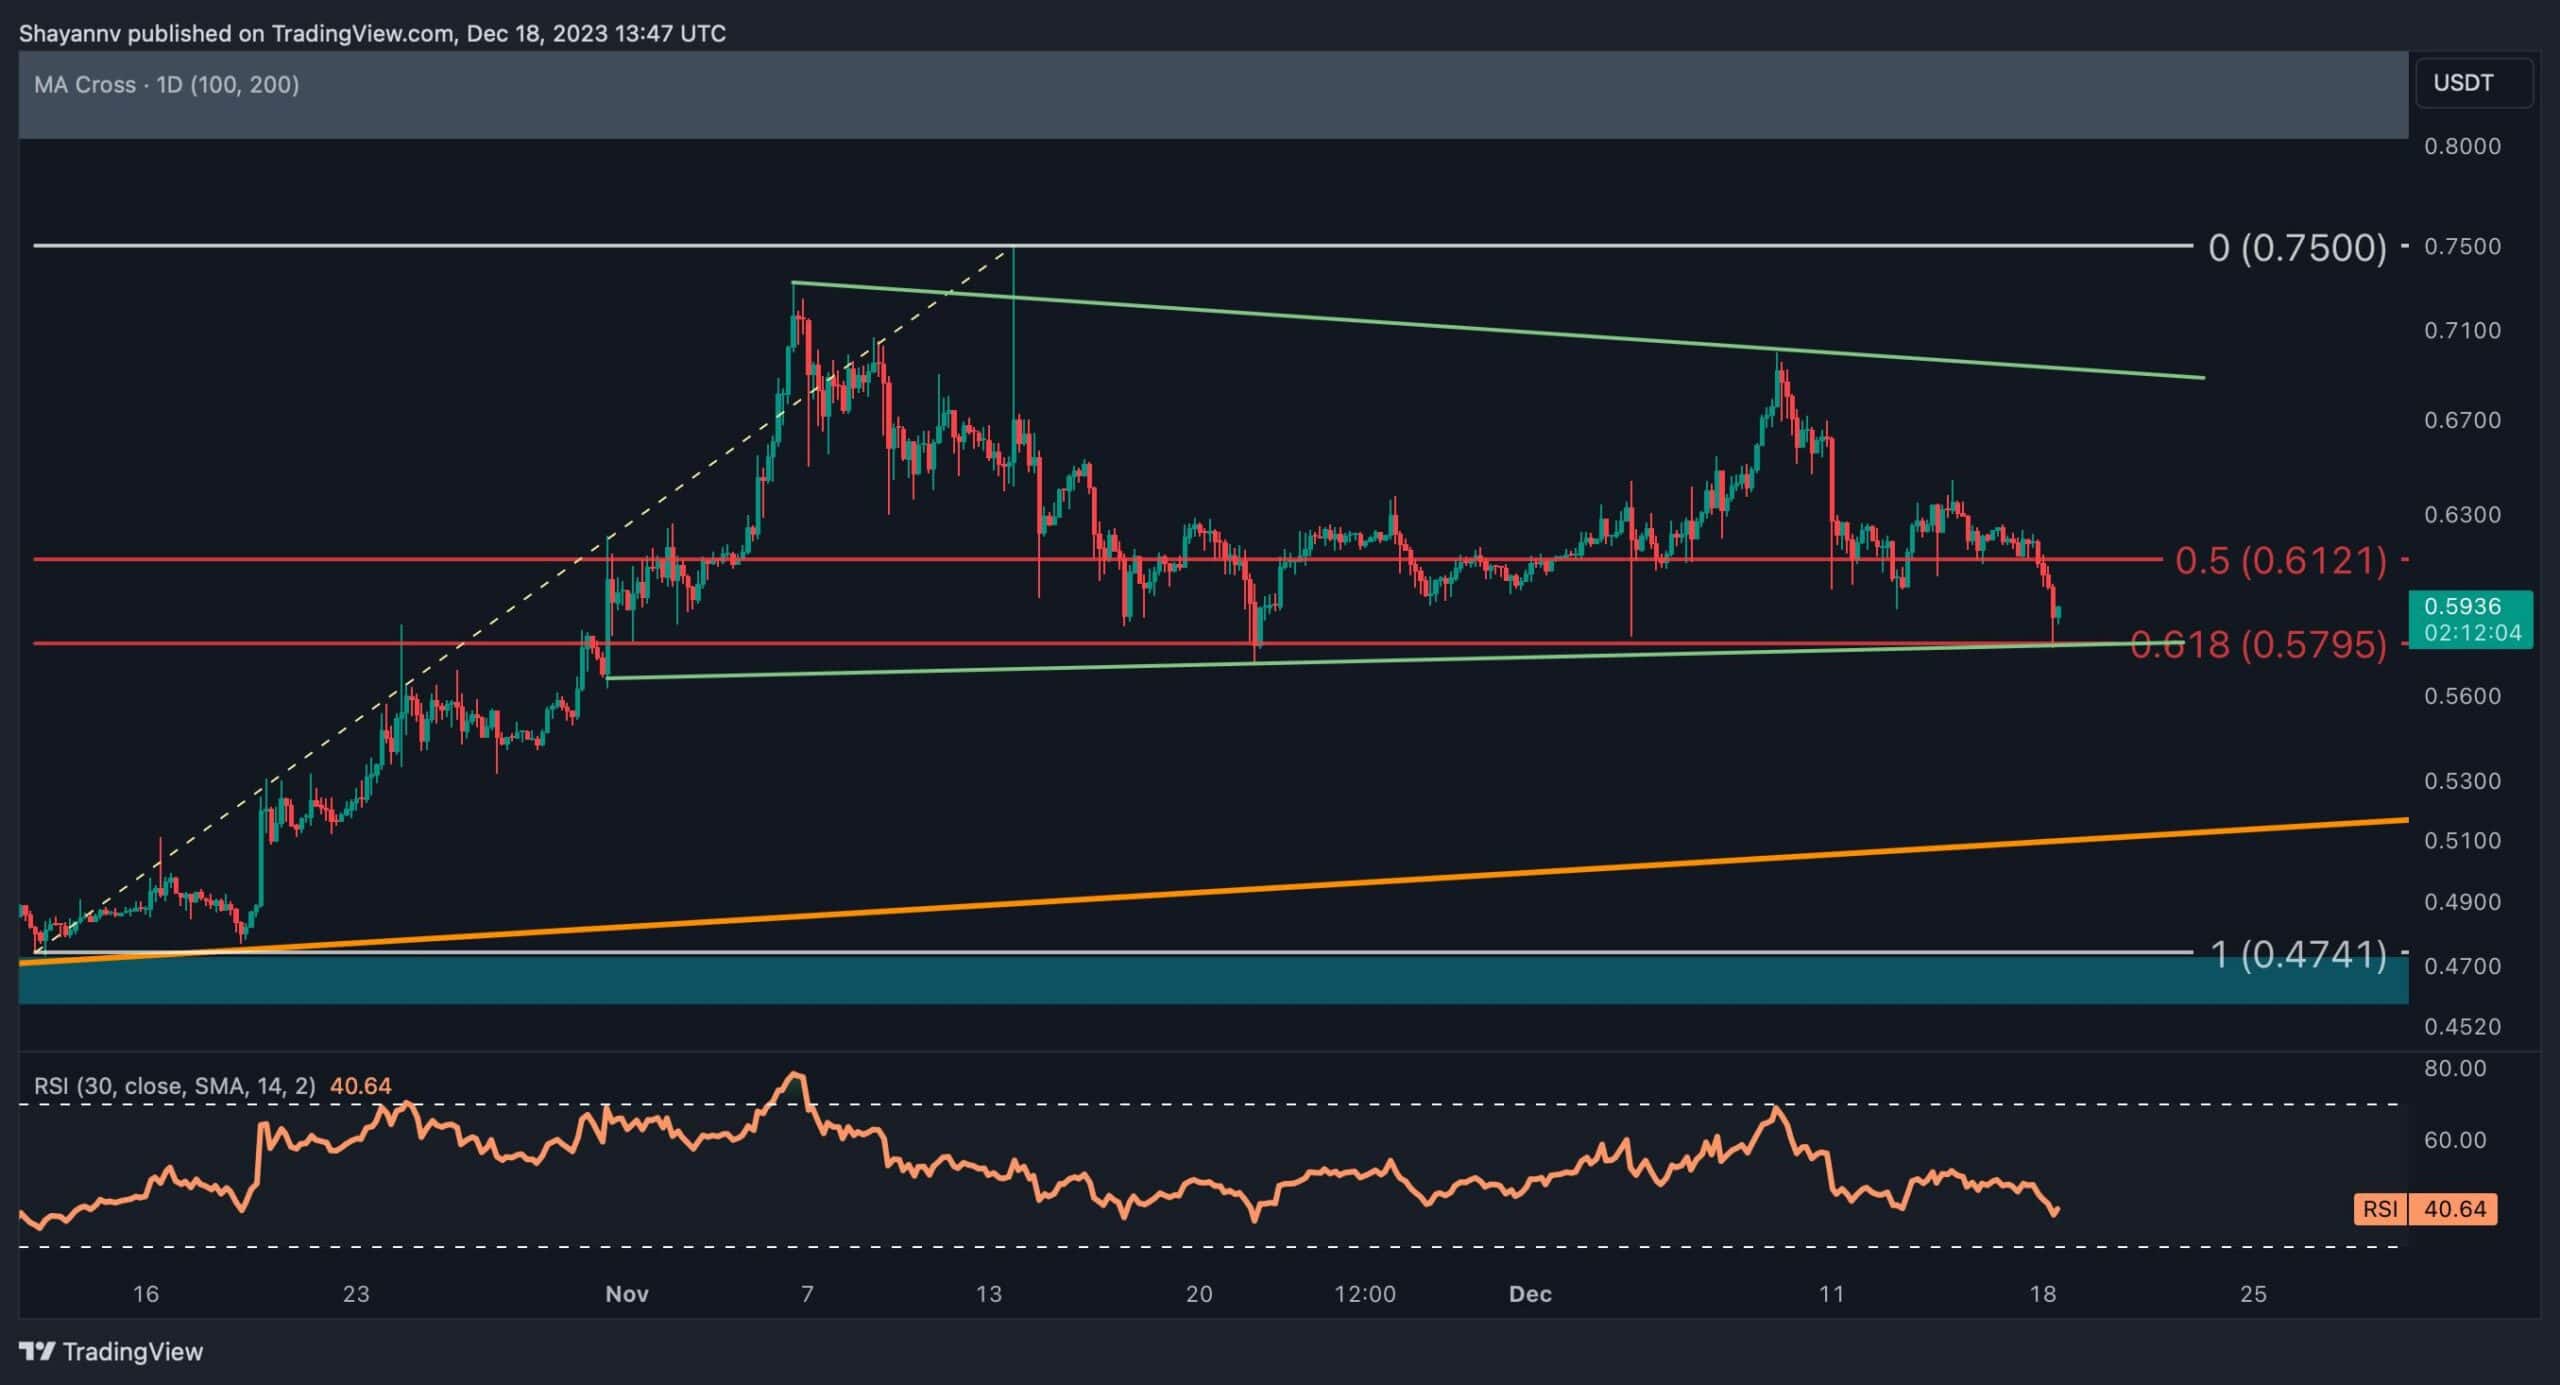
The 4-Hour Chart
Upon scrutiny of the 4-hour chart, it is observable that the price is currently undergoing a sideways consolidation phase, fluctuating between a critical support around $0.57 and a crucial resistance near $0.71. However, Ripple recently experienced a decline, reaching the lower boundary of the range at $0.57. This level coincides with the 0.618 Fibonacci retracement level, adding significance as a substantial support that may impede further downward trends.
Additionally, the price has formed a wedge pattern, with its lower trendline aligning with the $0.57 support region, providing stronger support to the price.
A potential decline below this critical support range could indicate an imminent significant downturn for XRP, necessitating careful consideration from market participants in anticipation of notable changes under such circumstances.
The post Two Possible Scenarios for XRP Going Into This Week (Ripple Price Analysis) appeared first on CryptoPotato.