Tron Price Analysis: TRX Price Skyrocketed by Over 30% in May, What Drives this Move?
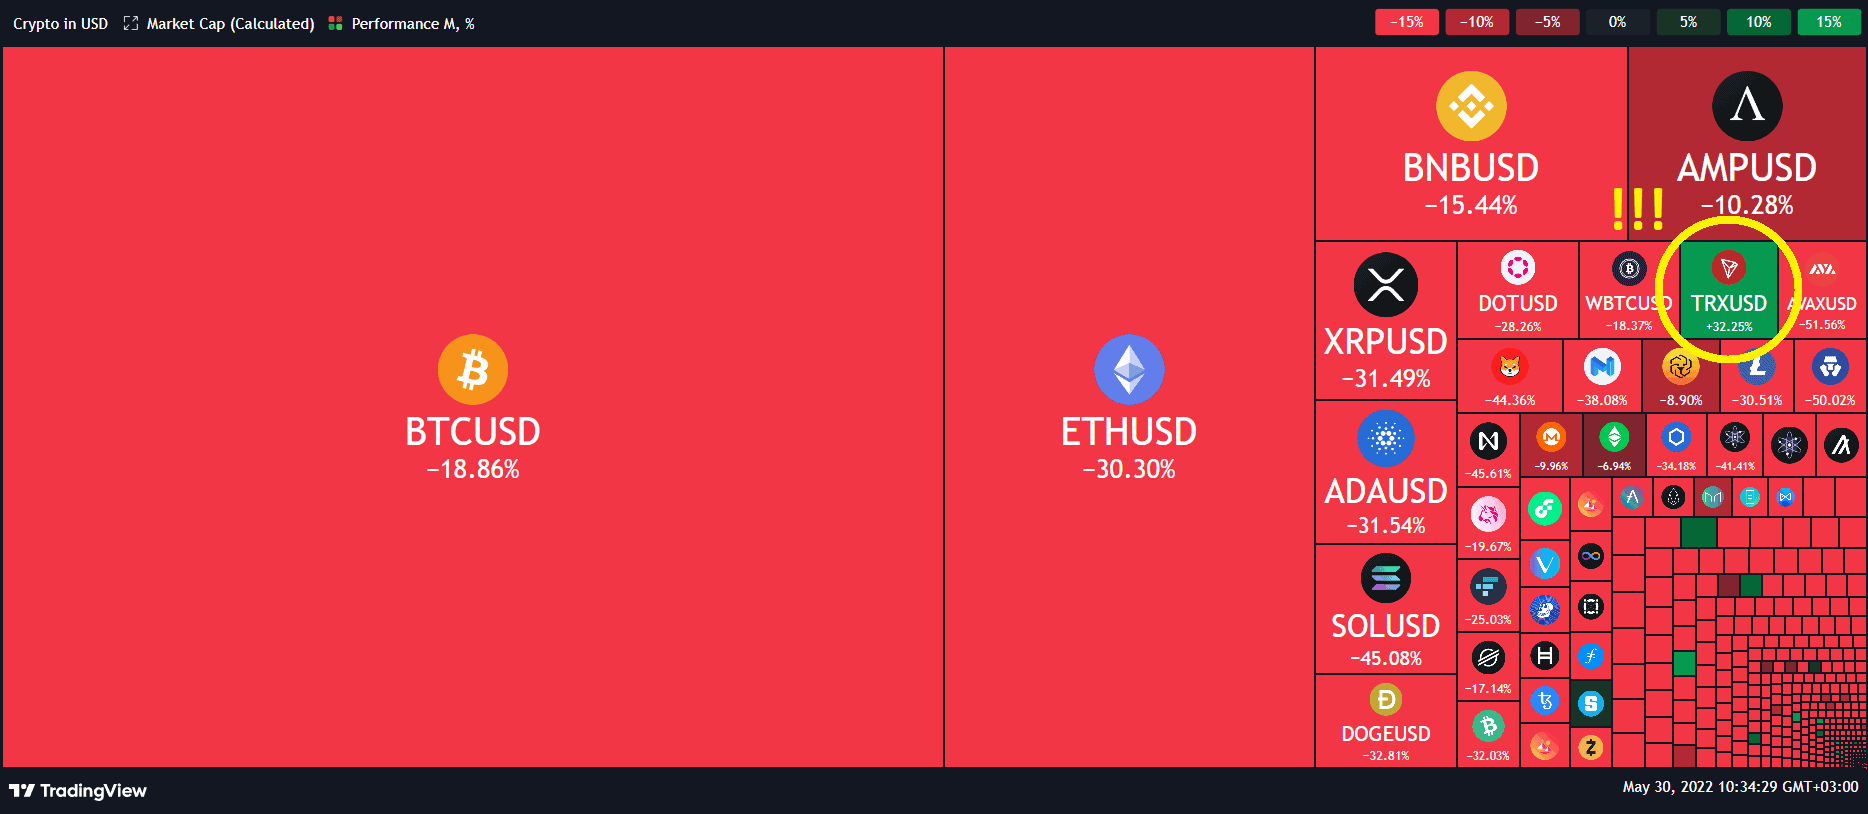
Tron outperformed the crypto market in May, increasing by over 30% this month at the time of this post (see below image). But what drives this growth and demand?

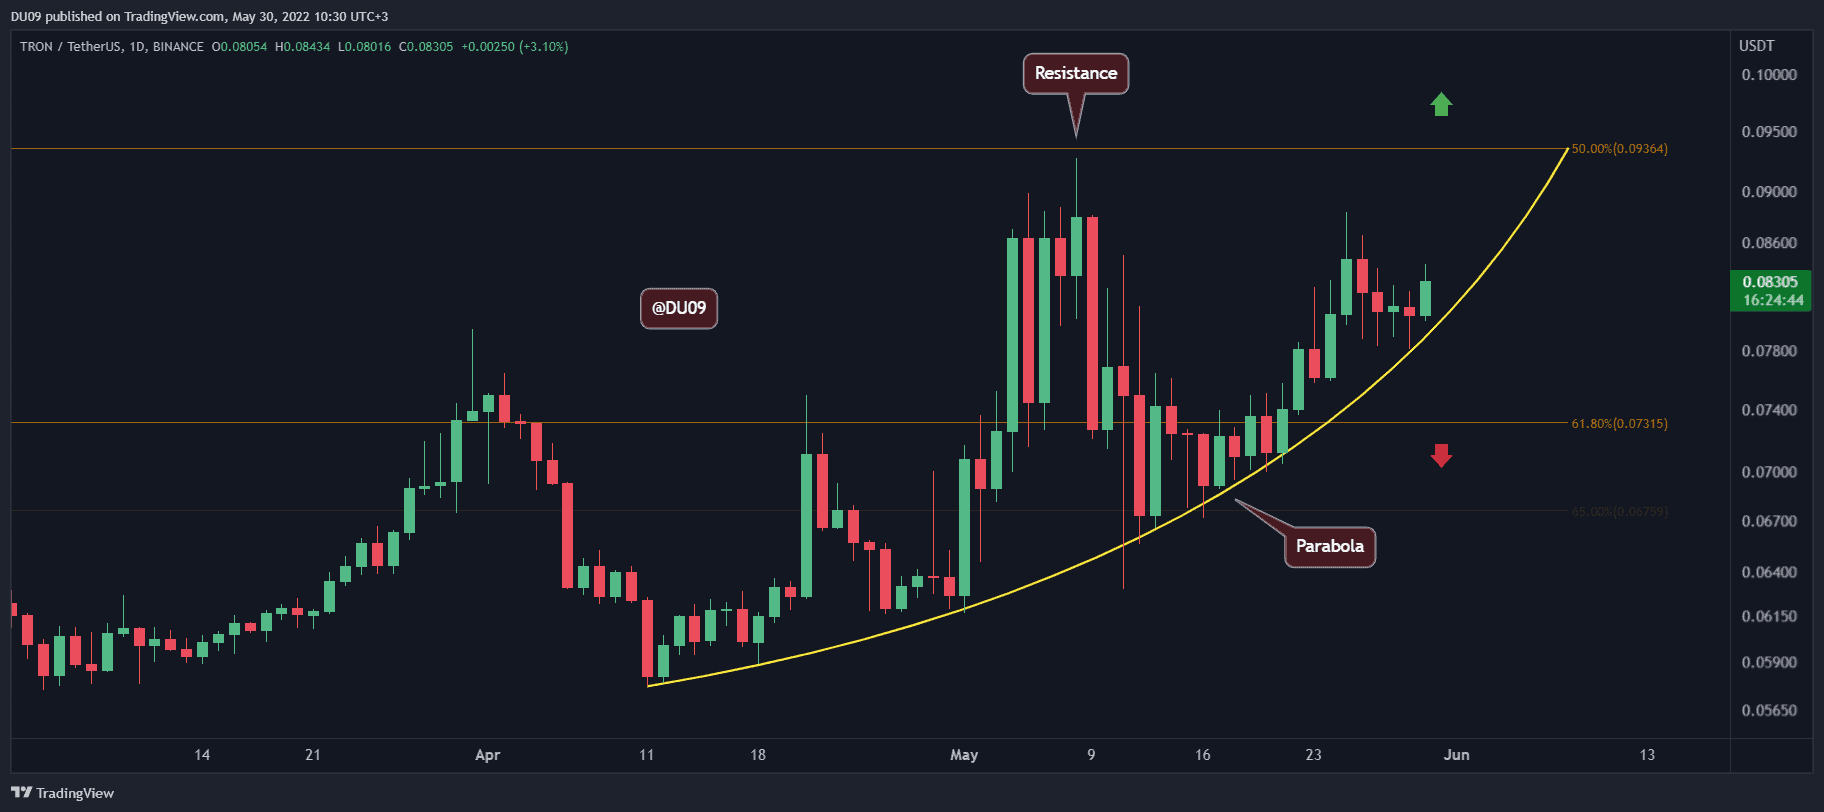
Key Support levels: $0.07
Key Resistance levels: $0.09
The fundamentals for Tron have changed with the introduction of the algorithmic stablecoin USDD in late April. So long as demand for USDD grows, TRX’s price is more likely to move higher. This is because TRX / USDD uses a similar burn/mint mechanism to Luna / UST.
As a result, the cryptocurrency has formed a bullish parabola which so far has acted as support. The key resistance is found at 9 cents, and if broken, the way will be opened for TRX to move higher. The current support is at 7 cents.

Technical Indicators
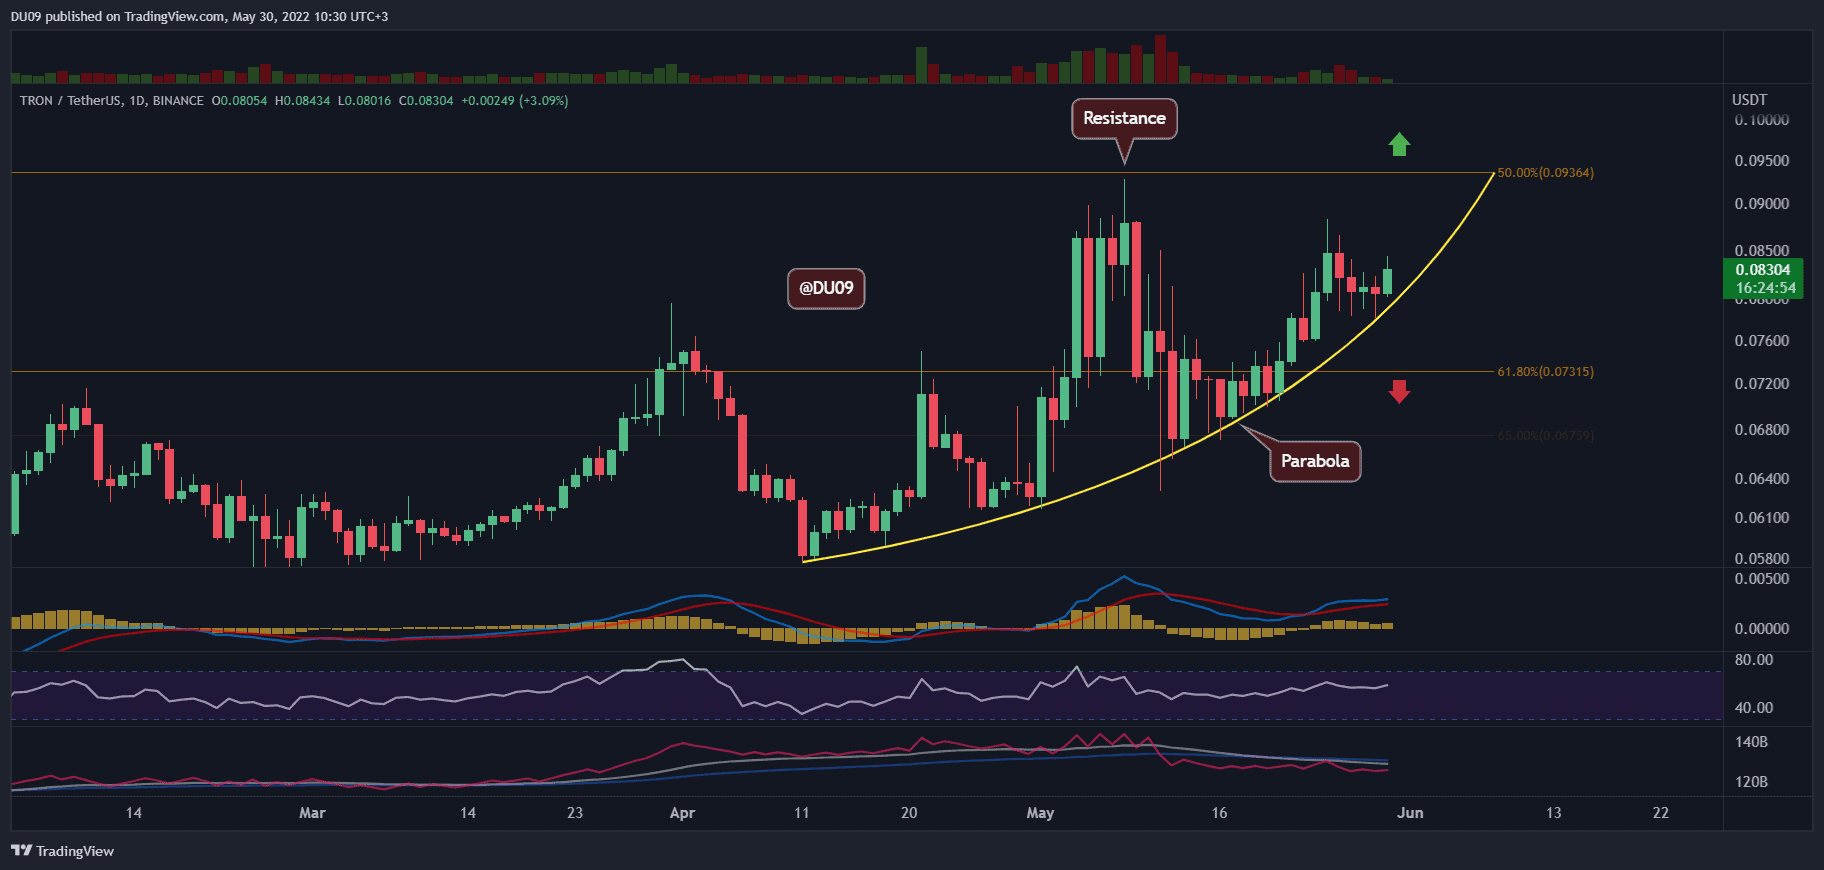
Trading Volume: The volume has not been great for TRX in the last few days, but despite this, the price still managed to move higher.
RSI: The daily RSI continues to remain above 50 points. This is a bullish signal, and the RSI has made a higher low as well.
MACD: The daily MACD is bullish, and the histogram just made a higher high. This shows a renewed interest in TRX, which could push the price all the way to the key resistance.

Bias
The bias for TRX is bullish, at least in terms of technicals for the short term.
Short-Term Prediction for TRX Price
With bullish fundamentals as well as a market that is keen to move higher after two months of correction, TRX is well-positioned to challenge the key resistance at 9 cents and quickly move higher. However, the parabola must hold as any break below it could signal a change in the uptrend.


