TRON Price Analysis: TRX Crossing 5-Month Highs Eyeing $0.03 As Next Target
- Tron surged above 3-month high, but the break is yet to confirm against Bitcoin
- TRX is poised for massive gains, but the price is still trading at a crucial resistance level
- Against USD, Tron is showing a lot of strength but trapped in a rising channel.
TRX/USD: TRX Crossed Five-Month High Following A Weekly Surge, Is $0.030 Next Bullish Target?
Key Resistance Levels: $0.030, $0.035
Key Support Levels: $0.022, $0.020
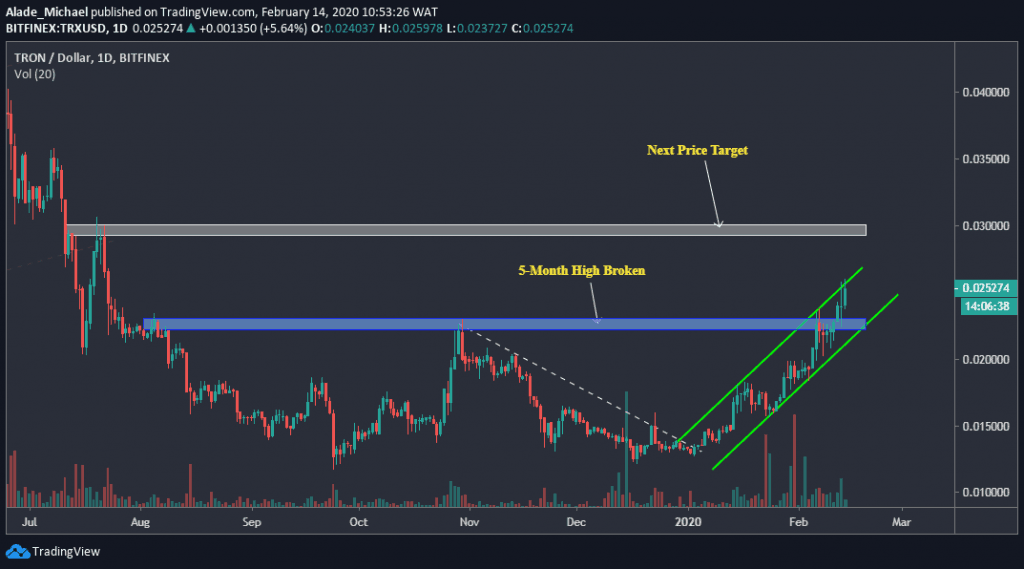
Since our previous analysis, Tron witnessed an expansion in volatility, which was quite significant over the past days. A 25% growth in a week brought TRX to $0.0252. Of course, the bulls are gaining control with a daily increase of 8.13% at the moment.
The 12th largest cryptocurrency by market cap finally crossed a five-month high of $0.022 following an eight days rally from $0.022. This rally has brought TRX price to the rising channel’s resistance at the moment.
Breaking this channel would trigger a quick gain to $0.030 in the grey resistance area. A retracement to the blue horizontal zone would allow a steady buy to the mentioned resistance.
Tron Price Analysis
Tron’s bullish sentiment started in early January following a break above the white-dotted regression line that was drawn from the late October 2019 high. This break led Tron into a rising channel pattern, which is still intact up till now.
The price is now testing the channel’s resistance after breaching the blue area of $0.022 two days ago. We can expect a retracement to $0.022 if TRX respects this channel boundary. A retracement below this channel could cause a sharp drop to $0.02 support. It may even reach $0.018 if the scenario gets uglier.
For a channel breakup, Tron is most likely to target $0.030 resistance in no time. A continuous surge should send TRX straight to $0.035 resistance. The trading volume is still moderate at the moment; a massive rally could be expected as long as buyers continue to stay in the market.
TRXBTC: Tron Is Footing A Long-Term Bullish Against Bitcoin
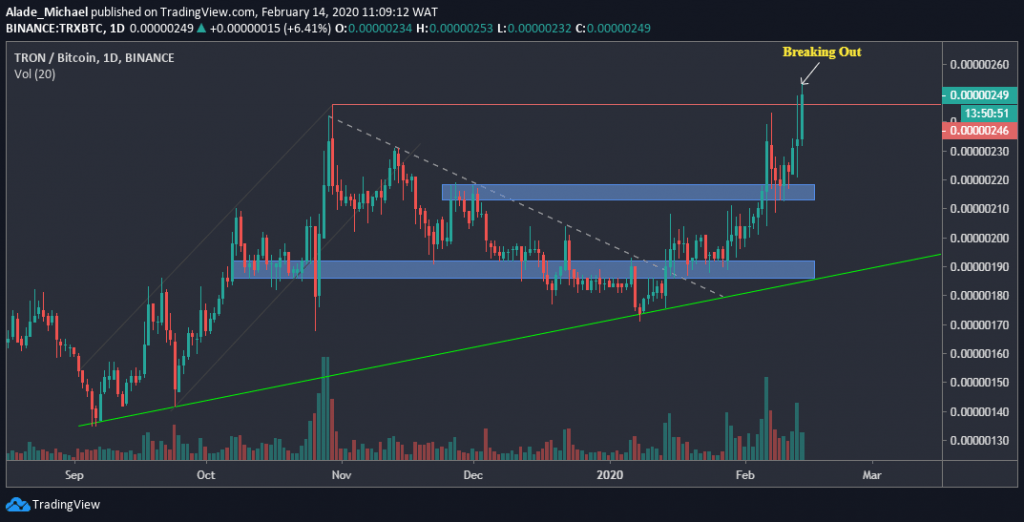
Over the past six weeks now, Tron has surged by 45% against Bitcoin and, at the same time, seen a relative growth of 7.83% over the last 24-hours. The bullish momentum appeared strong at the moment.
Today, Tron spiked to 253SAT level after a failed attempt to overcome the three-month high of 246SAT level. Though, the recent break is not confirmed yet. We need to see a clear and notable move above his critical resistance level before validating a breakout.
Meanwhile, this bullish break was footed from the 218SAT support level. If TRX pushes the price higher, we can expect this support to hold firm. A rejection might put a threat to this support if TRX fails to create a fresh high.
Tron Price Analysis
Looking at the ongoing daily price actions, Tron is likely to start a rally if the market can close well above the 246SAT level – the red line on the daily chart. The current price is 3SAT above. A clear cross above this red line should confirm a long-term bullish mode for Tron.
In this case, the immediate resistance to watch is 280SAT level. The next resistance is the 310SAT level. Tron is technically relying on a lot of support. If the price drops or fails to stay above the October 30, 3019 high (246SAT level), the key support to keep in mind is the 218SAT and 190SAT levels – marked blue area on the chart.
TRX volume is becoming significant at the moment. We can expect a huge buy in the next few days. The most important thing here is that TRX continues to enjoy support on the green rising trend line. This suggests that long-term bullish rally could be underway.
The post TRON Price Analysis: TRX Crossing 5-Month Highs Eyeing $0.03 As Next Target appeared first on CryptoPotato.