Top 30 Cryptocurrencies Gained 300% on Average in 2020: Report
In its annual report on the developments within the cryptocurrency field, the popular monitoring resource CoinGecko asserted that the top 30 coins by market cap added on average 300% in 2020.
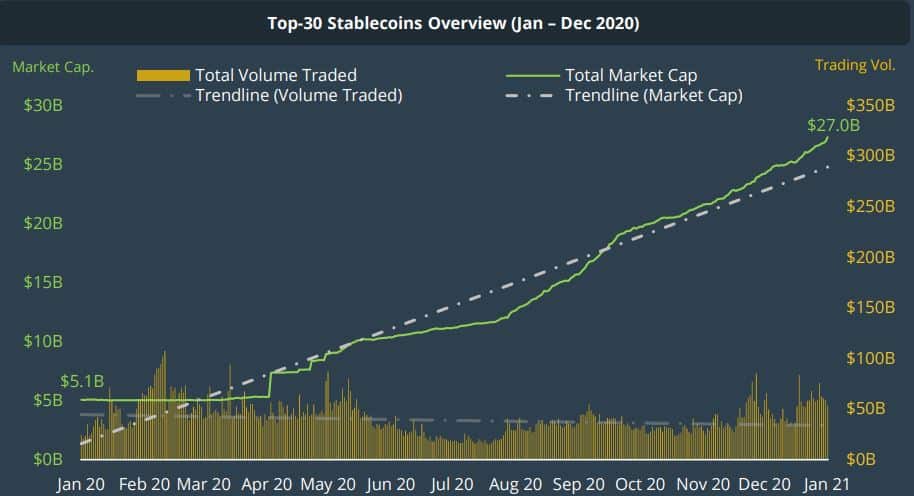
Moreover, the paper noted that the most widely-used stablecoins had neared $30 billion in circulation after a 440% surge.
2020: Best Price Performers
CoinGecko’s report noted that the market caps of the top 30 cryptocurrency assets grew by $552 billion (308%) in 2020. Thus, last year’s results have significantly outperformed the numbers of 2019, where the increase was by $68 billion (62%).
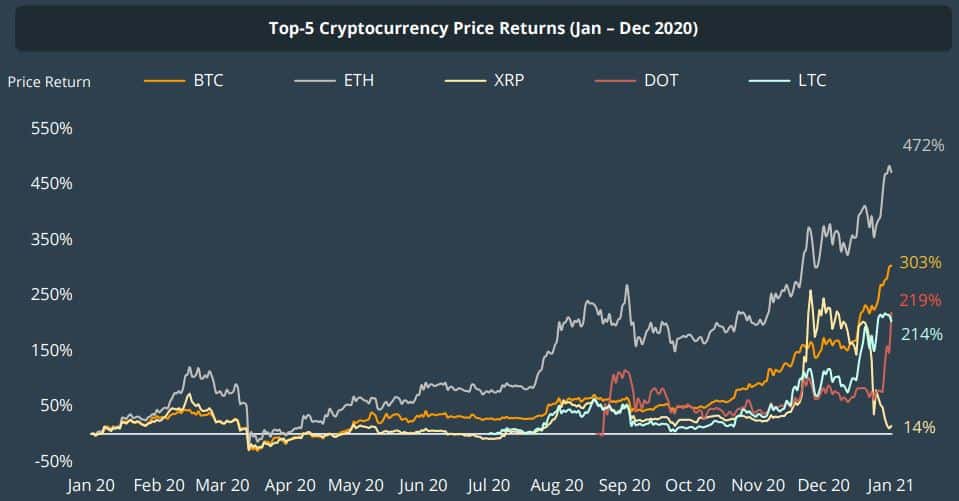
The percentage decreased slightly when examined just the top-5 cryptocurrencies to 242%. This difference comes primarily because of Ripple (XRP), which slumped in value at the end of 2020 following the SEC charges.
It’s also worth noting that Ethereum was the best performing large-cap cryptocurrency with a yearly surge of 472%. In comparison, BTC gained “just” 303% in 2020.

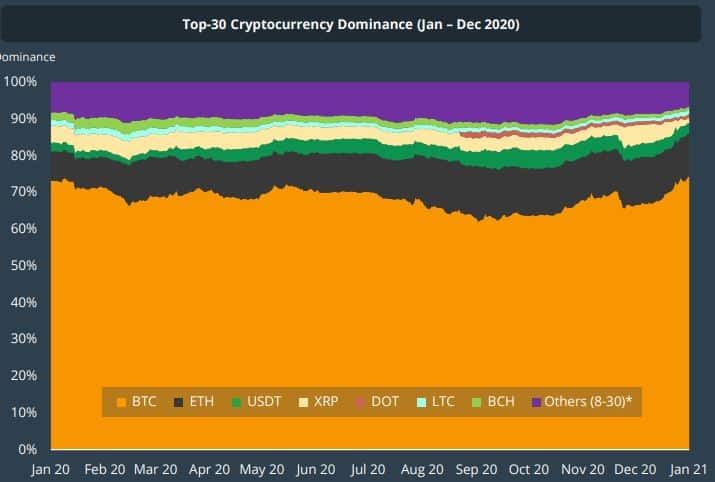
Naturally, this also meant that Ethereum has also outperformed Bitcoin in terms of market dominance. BTC’s dominance increased by 0.9% to 73.7%, while ETH’s grew by 3.6% to 11.5%.

The stablecoins in circulation added the most in 2020 as demand skyrocketed. The five most widely-utilized such assets, namely USDT, USDC, DAI, BUSD, and PAX, increased by over $22 billion in market cap to $27 billion – or 439%.
The report argued that this surge came “due to strong demand from traders in adopting stablecoins for trading and cross-border trade settlement.”
Tether remained the most dominant stablecoin, accounting for 76% of the market share, while DAI saw the most substantial growth of 2,700%.

Is The 2020/2021 Rally More Sustainable?
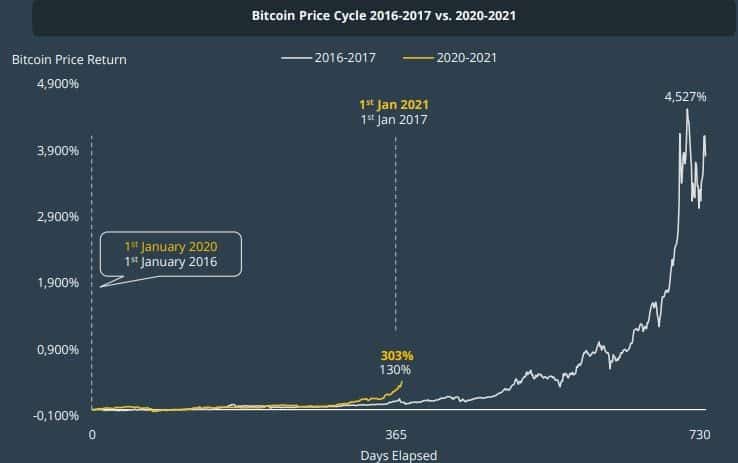
CoinGecko breached 730-day cycles and compared the 2016-2017 bitcoin price trajectory with the ongoing BTC rally. January 2016 and January 2021 served as the report’s half-way mark, in which the cryptocurrency had charted gains of 130% and 303%, respectively.
However, the paper said that BTC peaked at the end of the 2016/2017 rally at 4,527%. Should the asset mimic these gains, its price would skyrocket well into a six-digit territory.

Nevertheless, CoinGecko noted that the current rally seems significantly more sustainable because of three potential primary drivers.
- Accessibility – buying and selling digital assets is much easier now with numerous new designated exchanges. Additionally, companies with millions of users, such as Revolut and PayPal, also added cryptocurrency services.
- Stimulus and inflation – after the COVID-19 pandemic broke out, most central banks adopted a “loose” monetary policy. The trillions of fiat currencies printed in a relatively short period sparked concerns of future inflation, which, in turn, highlights BTC’s fixed supply of 21 million.
- Institutional adoption – the paper outlined the number of large corporations and institutions that announced allocating funds in bitcoin in the past several months. Some of the names include MicroStrategy, Square, Ruffer Investment, and high-net-worth individuals such as Paul Tudor Jones III and Stan Druckenmiller.


