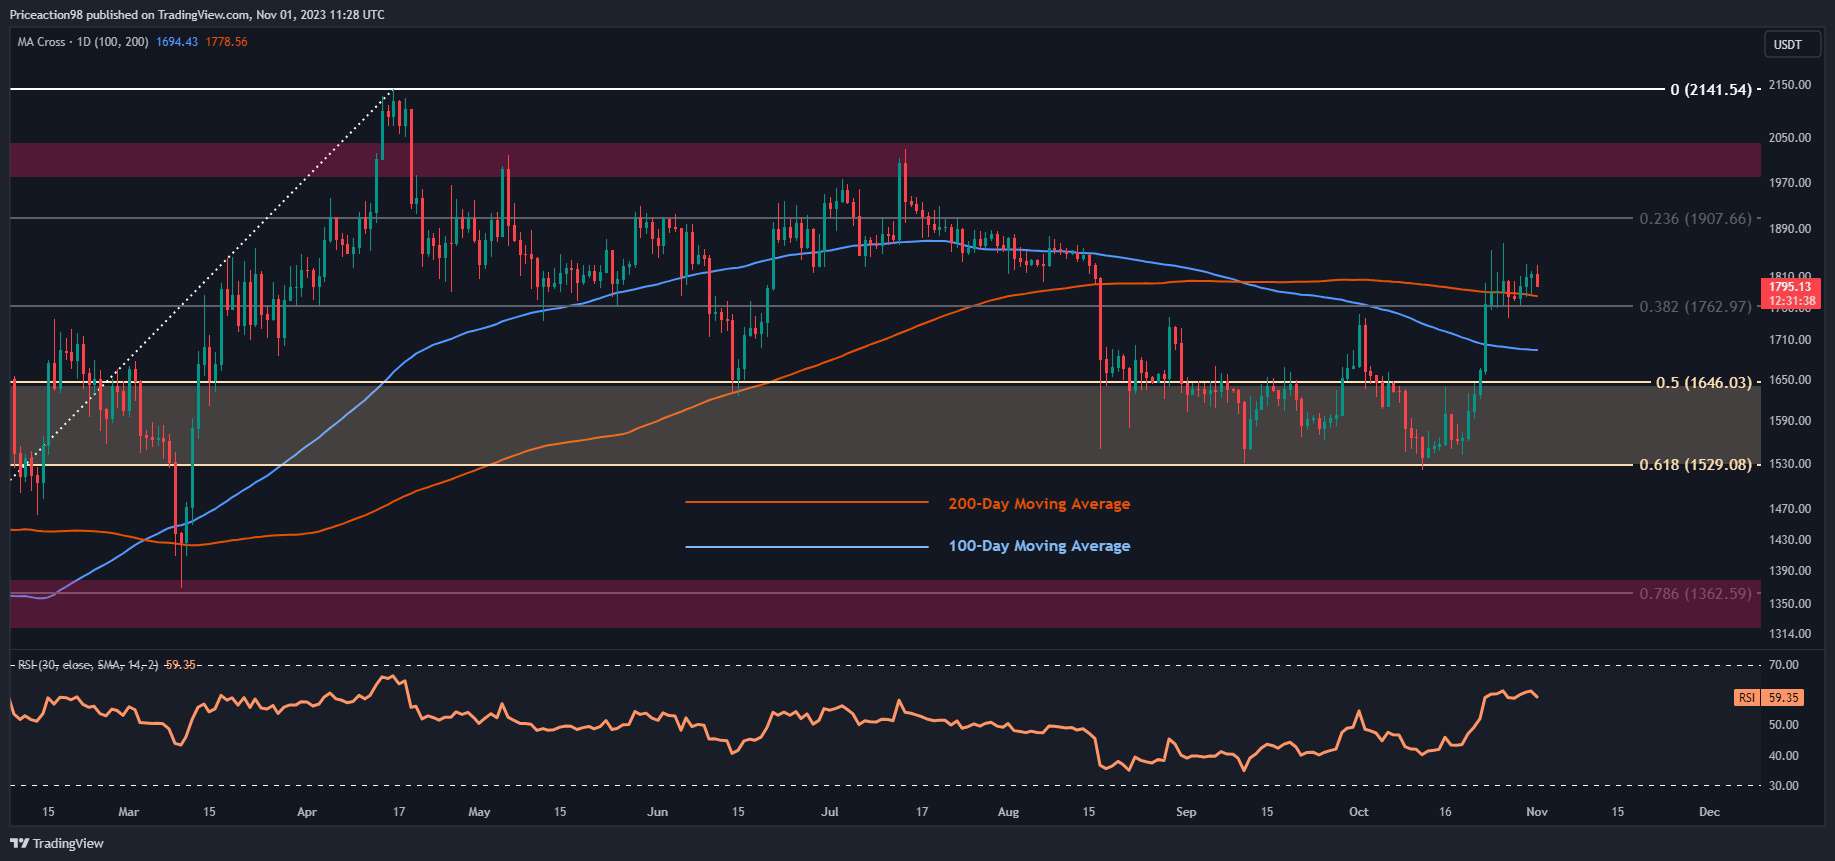
Three Arrows Capital Provided False Information and Exceeded AUM Threshold, MAS States
The Monetary Authority of Singapore (MAS) said it had reprimanded Three Arrows Capital on June 30.
- The central bank alleged that the beleaguered crypto hedge fund provided misleading information and also surpassed the assets under the management (AUM) threshold permitted for a registered fund management company (RFMC).
- The announcement stated,
“TAC had represented to MAS that it had novated the management of its fund to an unrelated offshore entity with effect from 1 September 2021. However, this representation was misleading as TAC and the offshore entity shared a common shareholder, Mr. Su Zhu, who is also a director of TAC. (Section 329(1) of the SFA).”
- Furthermore, 3AC also did not notify the regulator regarding changes in the directorships and shareholdings of its directors within the required timeline, the MAS said.
- The organization revealed that it will now investigate if 3AC was involved in any further breaches of its regulations.
- Once a high-profile crypto entity and a darling of last year’s bull market, 3AC has run into difficulties following the sharp sell-off in the market in the past months.
- It had been significantly invested in a number of troubled projects, including Terra.
- Crypto broker Voyager Digital issued a default notice after 3AC failed to make payments on a loan of 15,250 BTC and $350 million worth of USDC.
- The latest development comes after a British Virgin Islands court ordered the Singapore-based crypto hedge fund into liquidation.