This Support Level Will Determine Whether BTC Will Fall to $52K or Rise to $60K: Bitcoin Price Analysis
Bitcoin’s price has yet to show a willingness for recovery, as the market has failed to rebound from any support level.
As a result, things could get even worse in the coming days.
Technical Analysis
By Edris Derakhshi
The Daily Chart
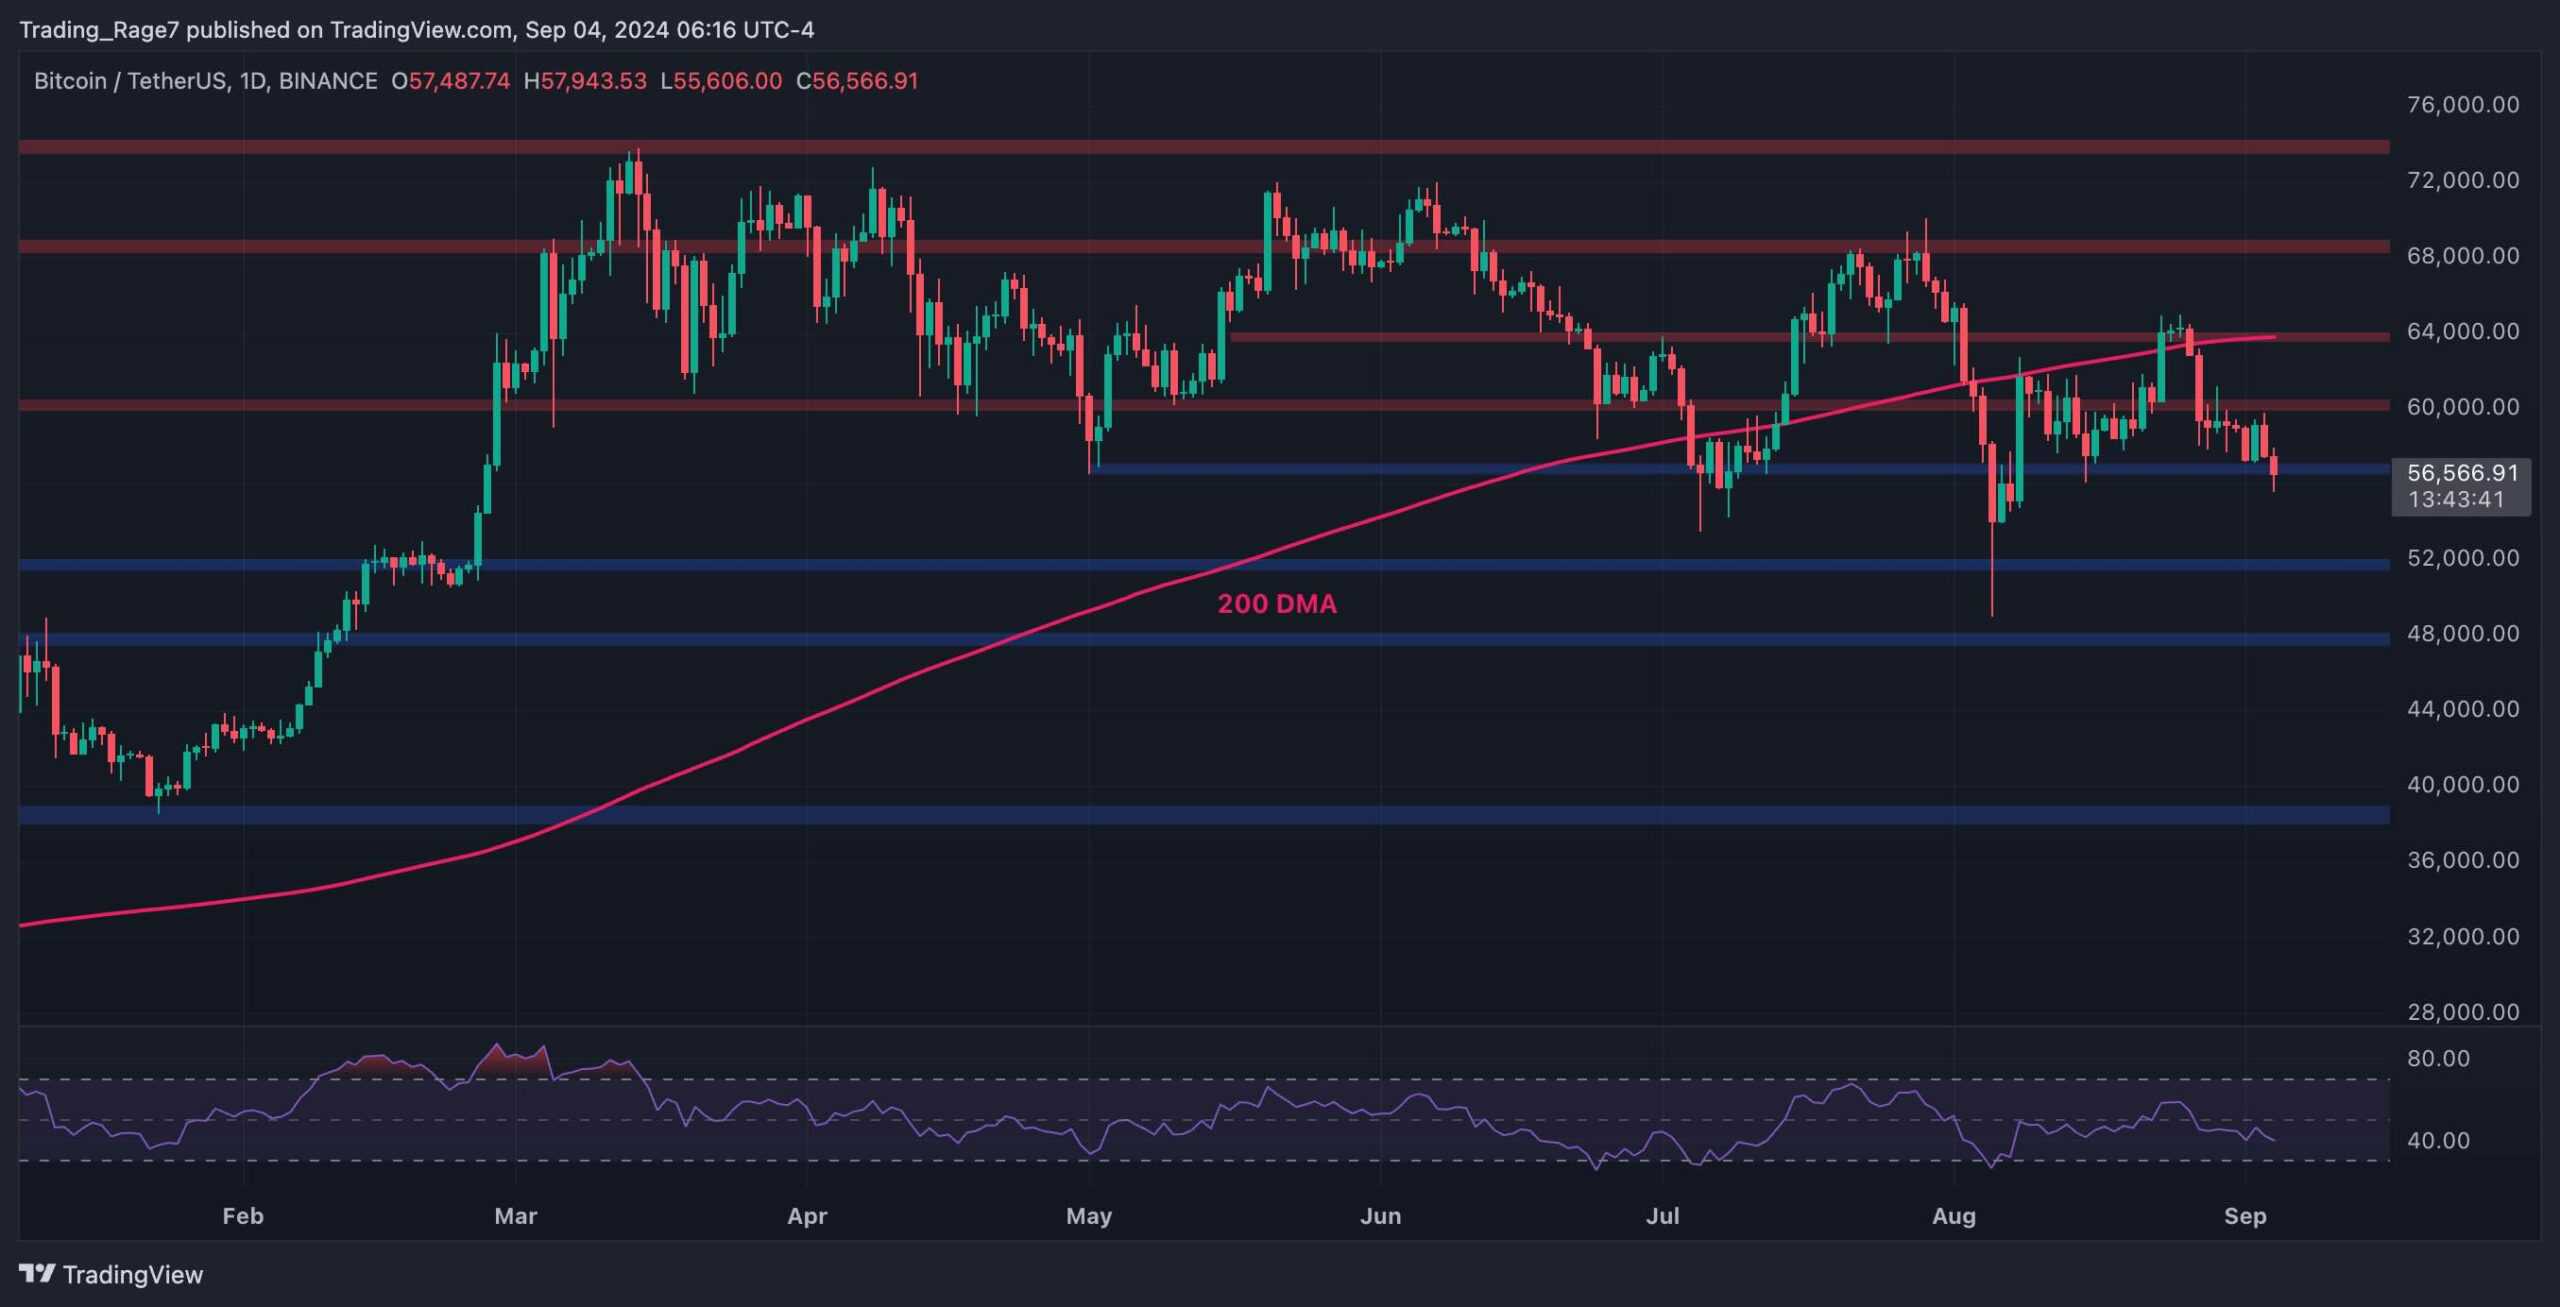
On the daily chart, the asset has been moving lower since its rejection from the $64K resistance level and the 200-day moving average, located around the same area.
The market has also lost the $60K level and is currently penetrating the $56K support zone. If this level breaks down, a further drop toward the $52K area would be imminent in the short term. With the RSI also showing clear bearishness in market momentum, a decline seems probable.
The 4-Hour Chart
Looking at the 4-hour chart, there might still be hope for BTC. The asset has been gradually trending down inside a descending channel above $56K. However, the market is currently testing the lower boundary of the channel. In case of a bearish breakout, an aggressive plunge toward the $52K level would be very likely.
However, if the channel holds, investors can be hopeful for a bullish breakout and a subsequent retest of the $60K level.
On-Chain Analysis
By Edris Derakhshi
Bitcoin Short-Term Holder SOPR
While technical analysis is a valuable tool in anticipating short-term market movements, it might not be a sufficient means for understanding the market dynamics behind the trends.
This chart presents the Bitcoin Short-Term Holder SOPR, which measures the ratio of profits/losses realized by short-term market participants. Values above 1 indicate profit realization, while values below 1 are associated with losses. Therefore, to have a better overview of the aggregate state and sentiment of investors, the STH-SOPR is quite a useful indicator.
As the chart demonstrates, the 30-day exponential moving average of the STH SOPR metric has been below 1 for some time now. This indicates that many short-term investors have been realizing losses during the recent price consolidation. So, if this behavior continues, the resulting supply could overwhelm demand and lead to even lower prices in the coming weeks.
The post This Support Level Will Determine Whether BTC Will Fall to $52K or Rise to $60K: Bitcoin Price Analysis appeared first on CryptoPotato.


