This is the Level ETH Needs to Reclaim to Turn Back Bullish (Ethereum Price Analysis)
Ethereum is about to close an eighth consecutive red week. High-risk assets, including stocks and cryptocurrencies, are experiencing a devastating year in 2022. But where is the next significant support for ETH?
Technical Analysis
Technical Analysis By Grizzly
The Daily Chart
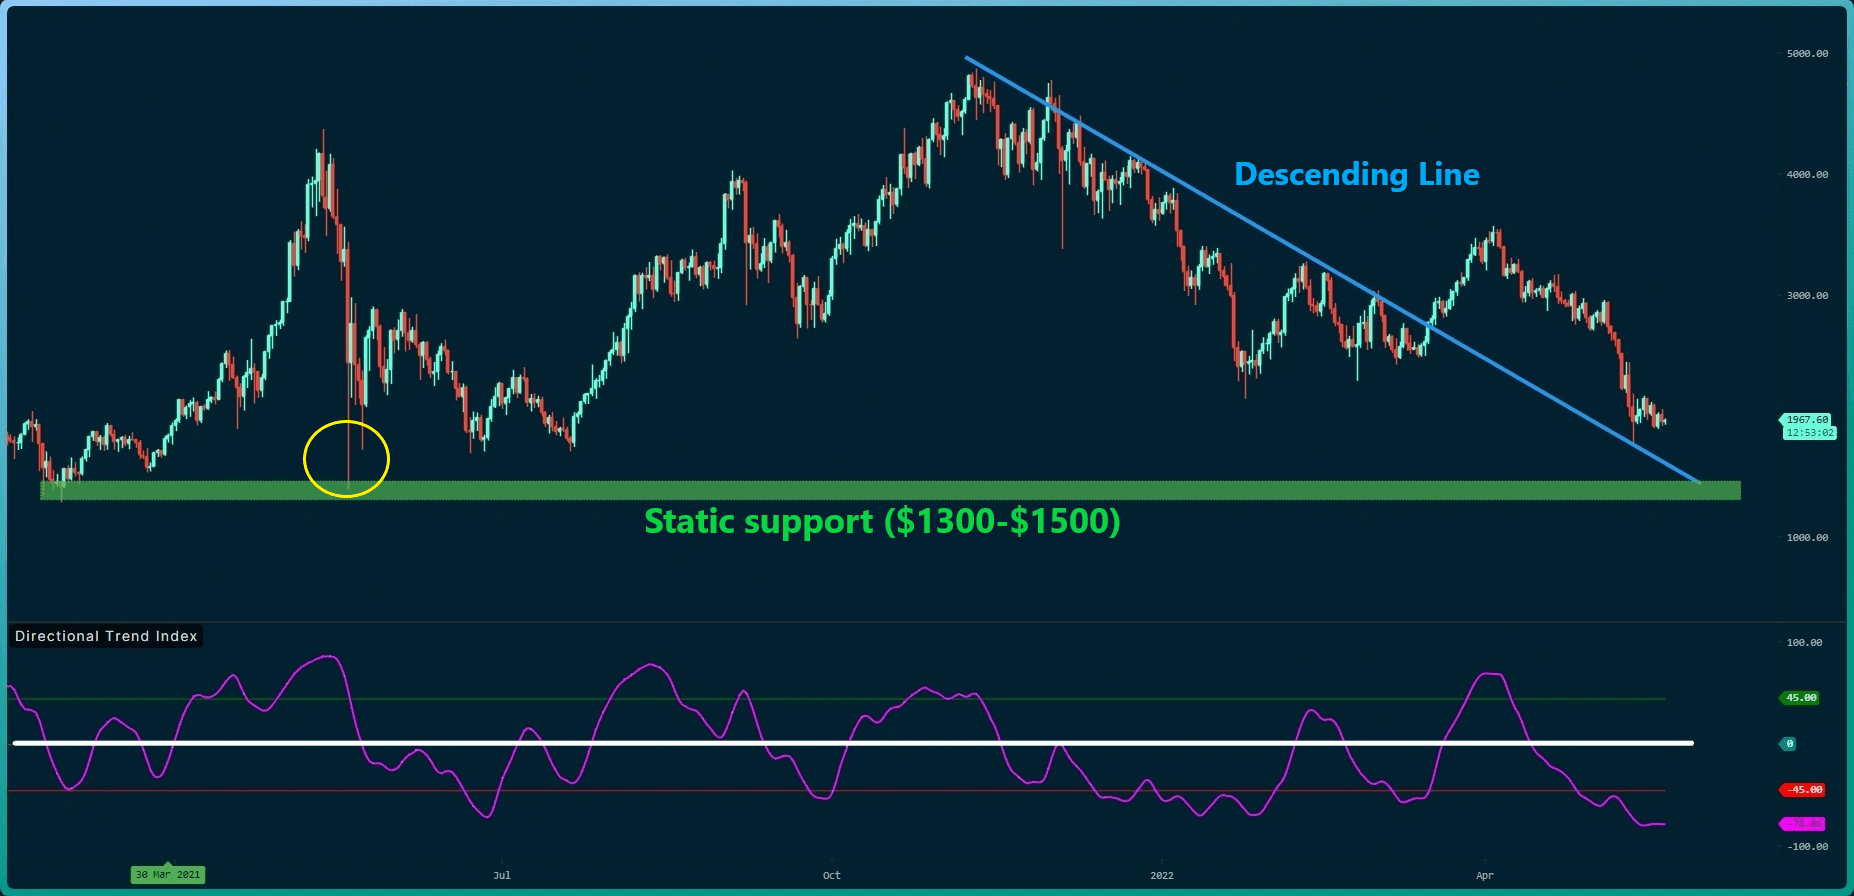
After Ethereum overcame its key dynamic resistance in March, it raised the possibility of an uptrend. However, things returned bearish in early April, as ETH fell unexpectedly.
Currently, the price is back upon the descending line (marked in blue), which is now acting as support. This structure means that the bulls did not have adequate power to push the price above.
This weakness in the trend is also seen in the daily candlesticks: It was exactly a year ago, on May 19, 2021, when the price reached the green demand zone where the high buying pressure caused the daily candle to close with a long bullish wick (to the downside). As can be seen, this area lies in the range between $1300 – $1500.
On the other hand, and looking at the mid and longer-term, the existing bearish momentum will change if bulls reclaim the resistance level at $2450.
The Directional trend index (in purple) moves below the red line, indicating that the bears are still completely controlling the market. This indicator is an insightful tool to track the bull and bears dominance in the market. For instance, if the index returning above the white horizontal line indicates bulls are back.

Key Support Levels: $1700 & $1500
Key Resistance Levels: $2200 & $2450
Moving Averages:
MA20: $2299
MA50: $2764
MA100: $2812
MA200: $3277
The ETH/BTC Chart
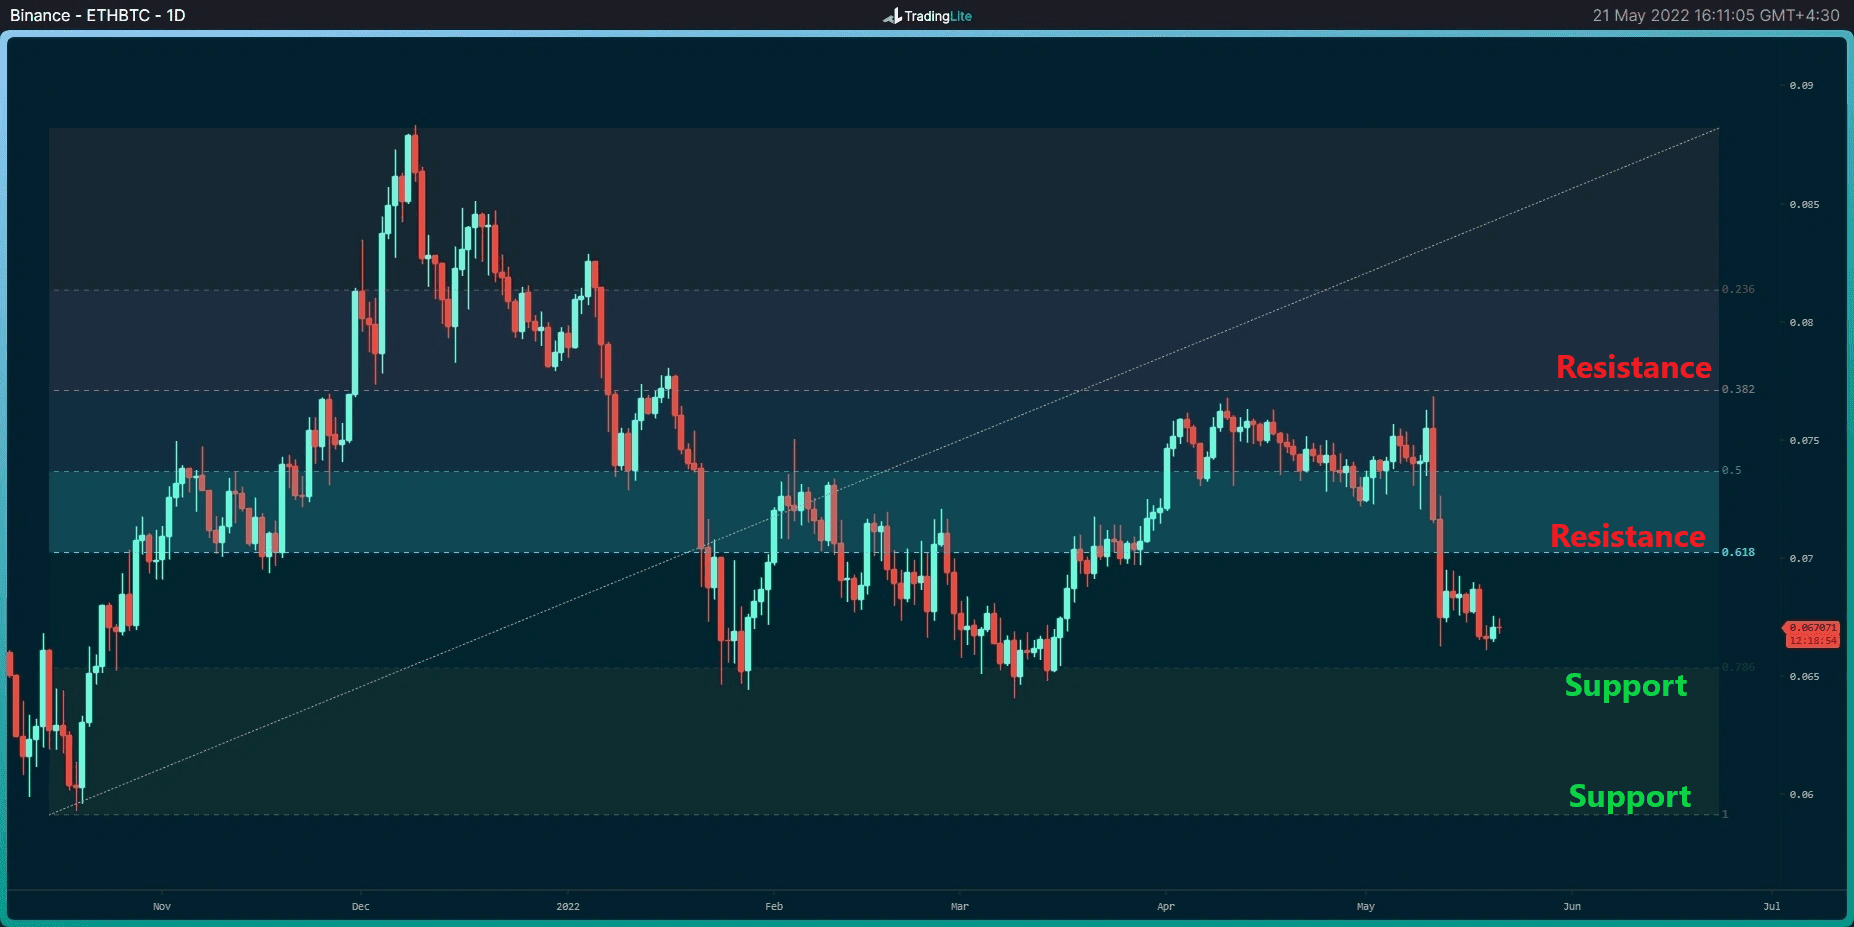
According to the BTC pair chart, the price is approaching a horizontal support level at 0.065, which has successfully supported the price twice in 2022.
This level will likely be tested again soon, and if bulls can defend it another time, there is a possibility of moving upwards towards resistance at 0.07. However, suppose the bears overwhelm the bulls. In that case, there is a possibility of many stop losses being triggered below 0.065, which will probably accelerate the current bearish trend of ETH against BTC.
Key Support Levels: 0.065 BTC & 0.06 BTC
Key Resistance Levels: 0.07 BTC & 0.072 BTC

On-chain Analysis
Number of Addresses with Balance Equal to or Greater than 100
Definition: The number of unique addresses holding at least 100 coins. Only Externally Owned Addresses (EOA) are counted, and contracts are excluded.
In the chart, the number of addresses that hold at least 100 ETH (green circle) has been rising throughout the recent market crash. When this metric started to rise, the price followed shortly after. However, the accumulation by this indicator has not been as significant as in the two previous instances.
If the accumulation increase continues, it may lead to a supply shock and price appreciation, even for a short-term correction.


