This Is BTC’s Next Target After Surging 4% Daily: Bitcoin Price Analysis
Bitcoin’s price has been trending lower since the last week of August, breaking below multiple support levels.
Yet, it’s currently showing signs of a possible rebound, as the asset jumped by more than four grand yesterday. Could there be more bullish moves on the horizon?
Technical Analysis
By Edris Derakhshi
The Daily Chart
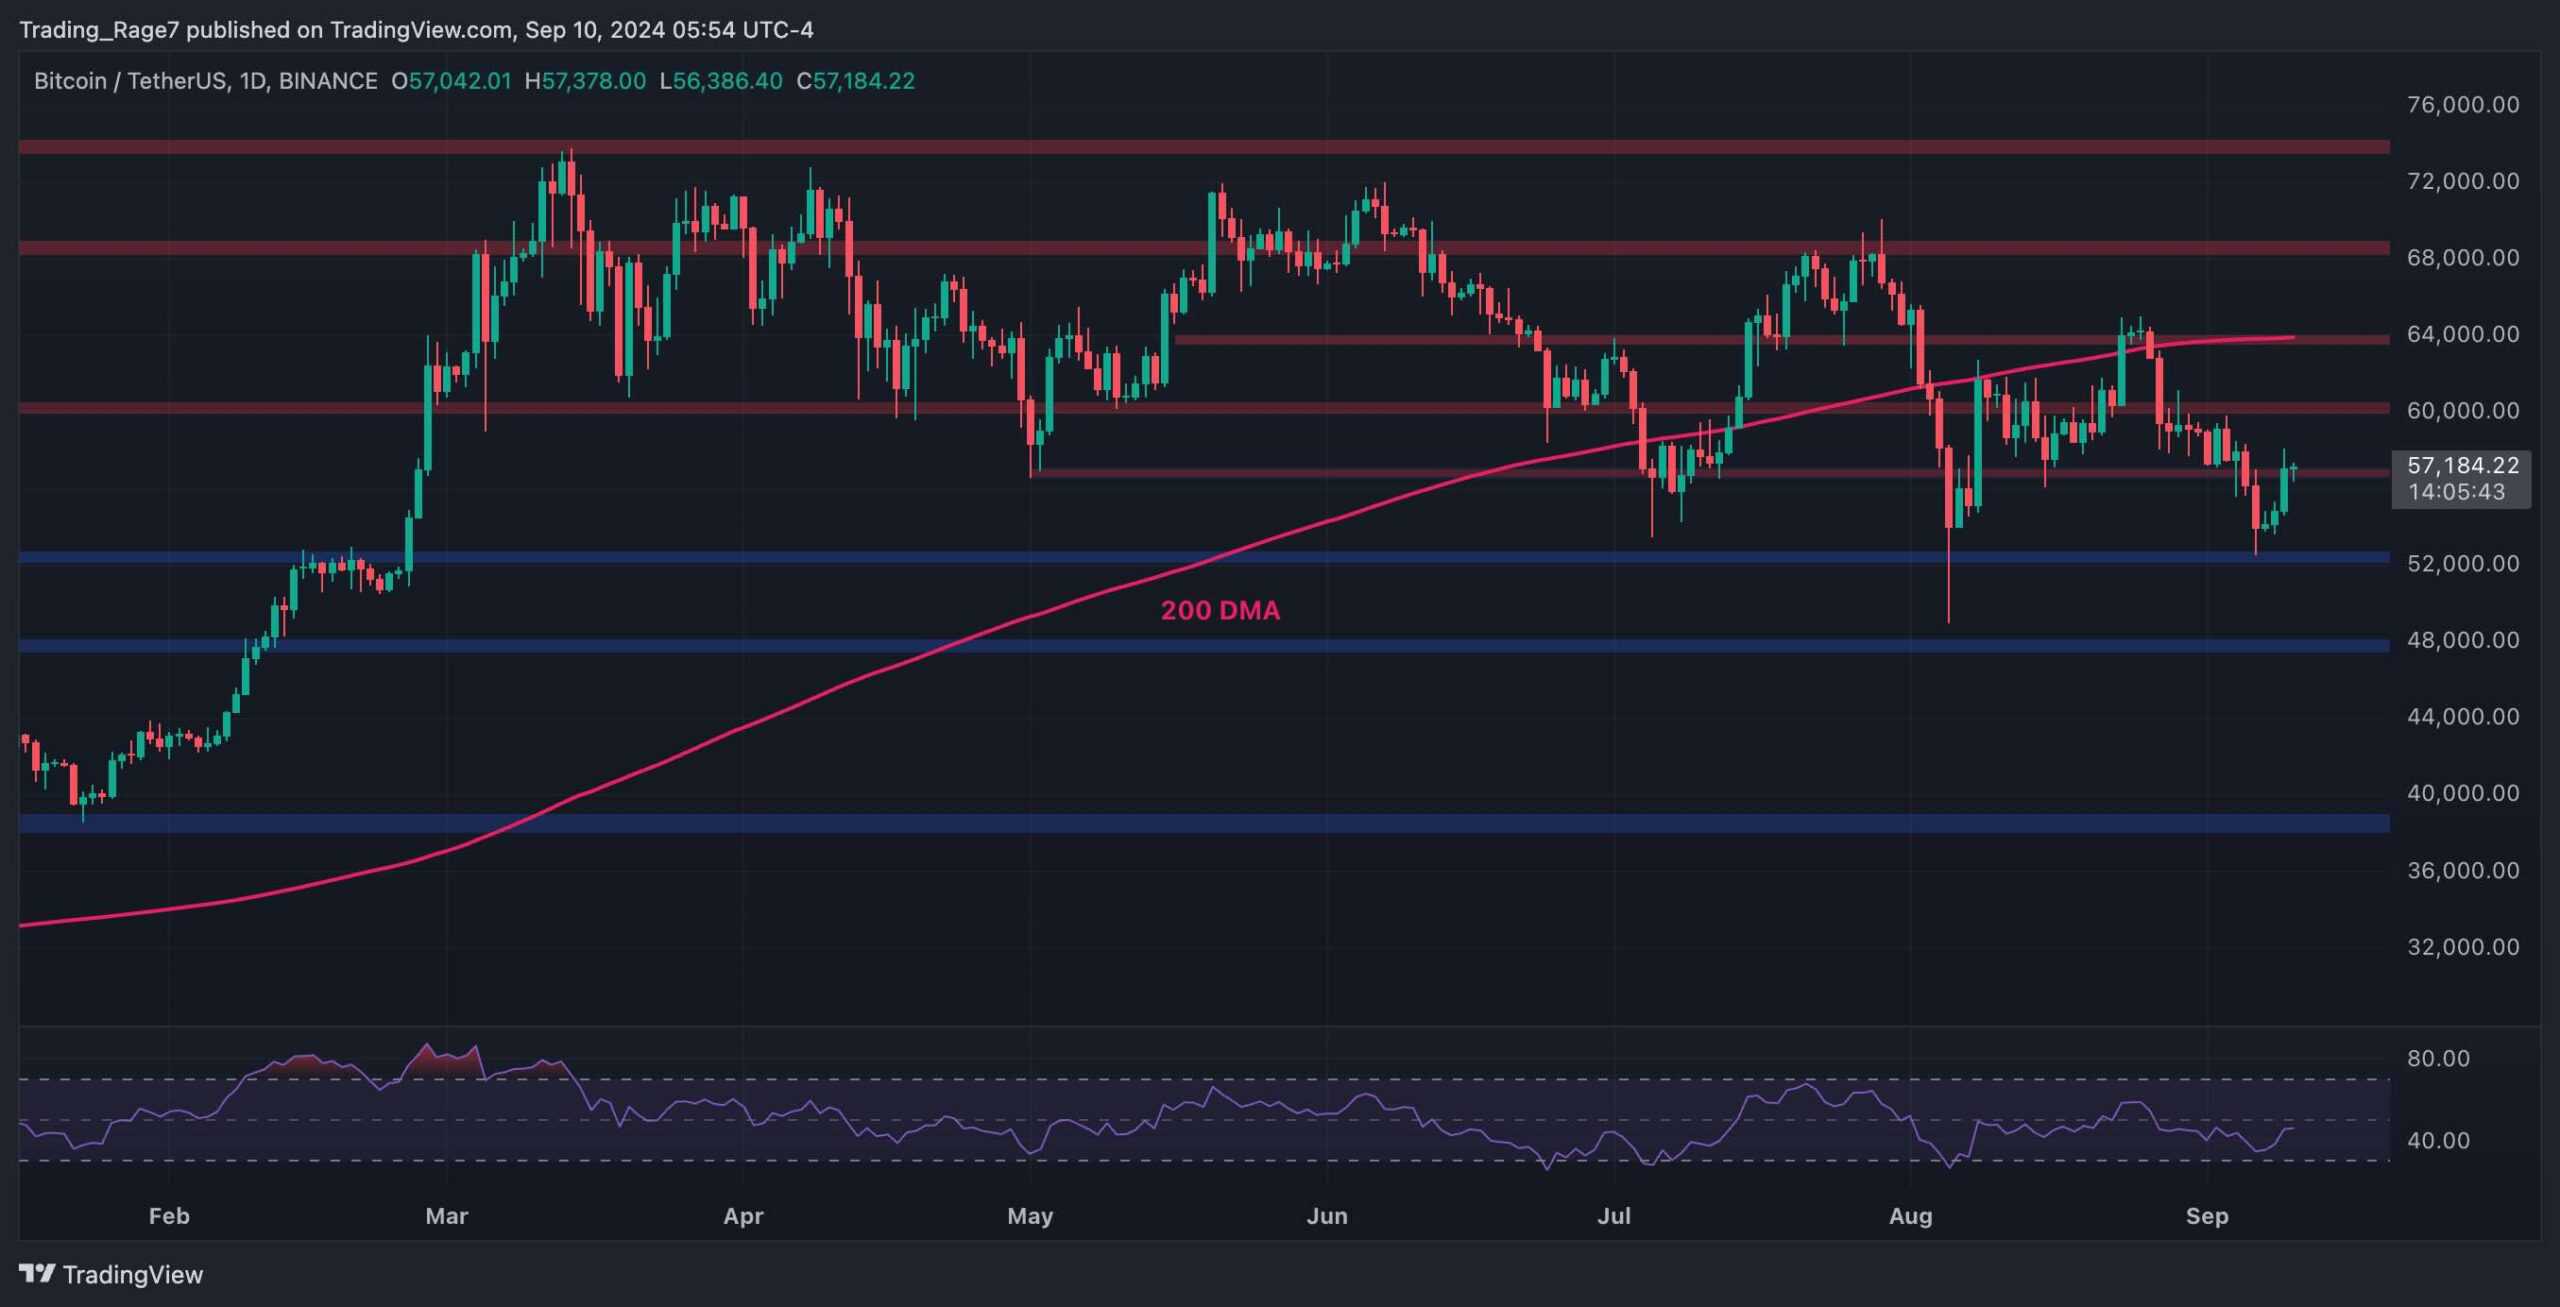
The daily chart demonstrates that the BTC price has dropped since getting rejected from the 200-day moving average, located around the $64K resistance level. Several support levels have been lost since, and the price has dropped to just over $52K.
The market has rebounded slightly from that level, but the momentum is clearly bearish. As a result, the asset still needs to break above the $64K zone and the 200-day moving average to begin a new bullish trend.
The 4-Hour Chart
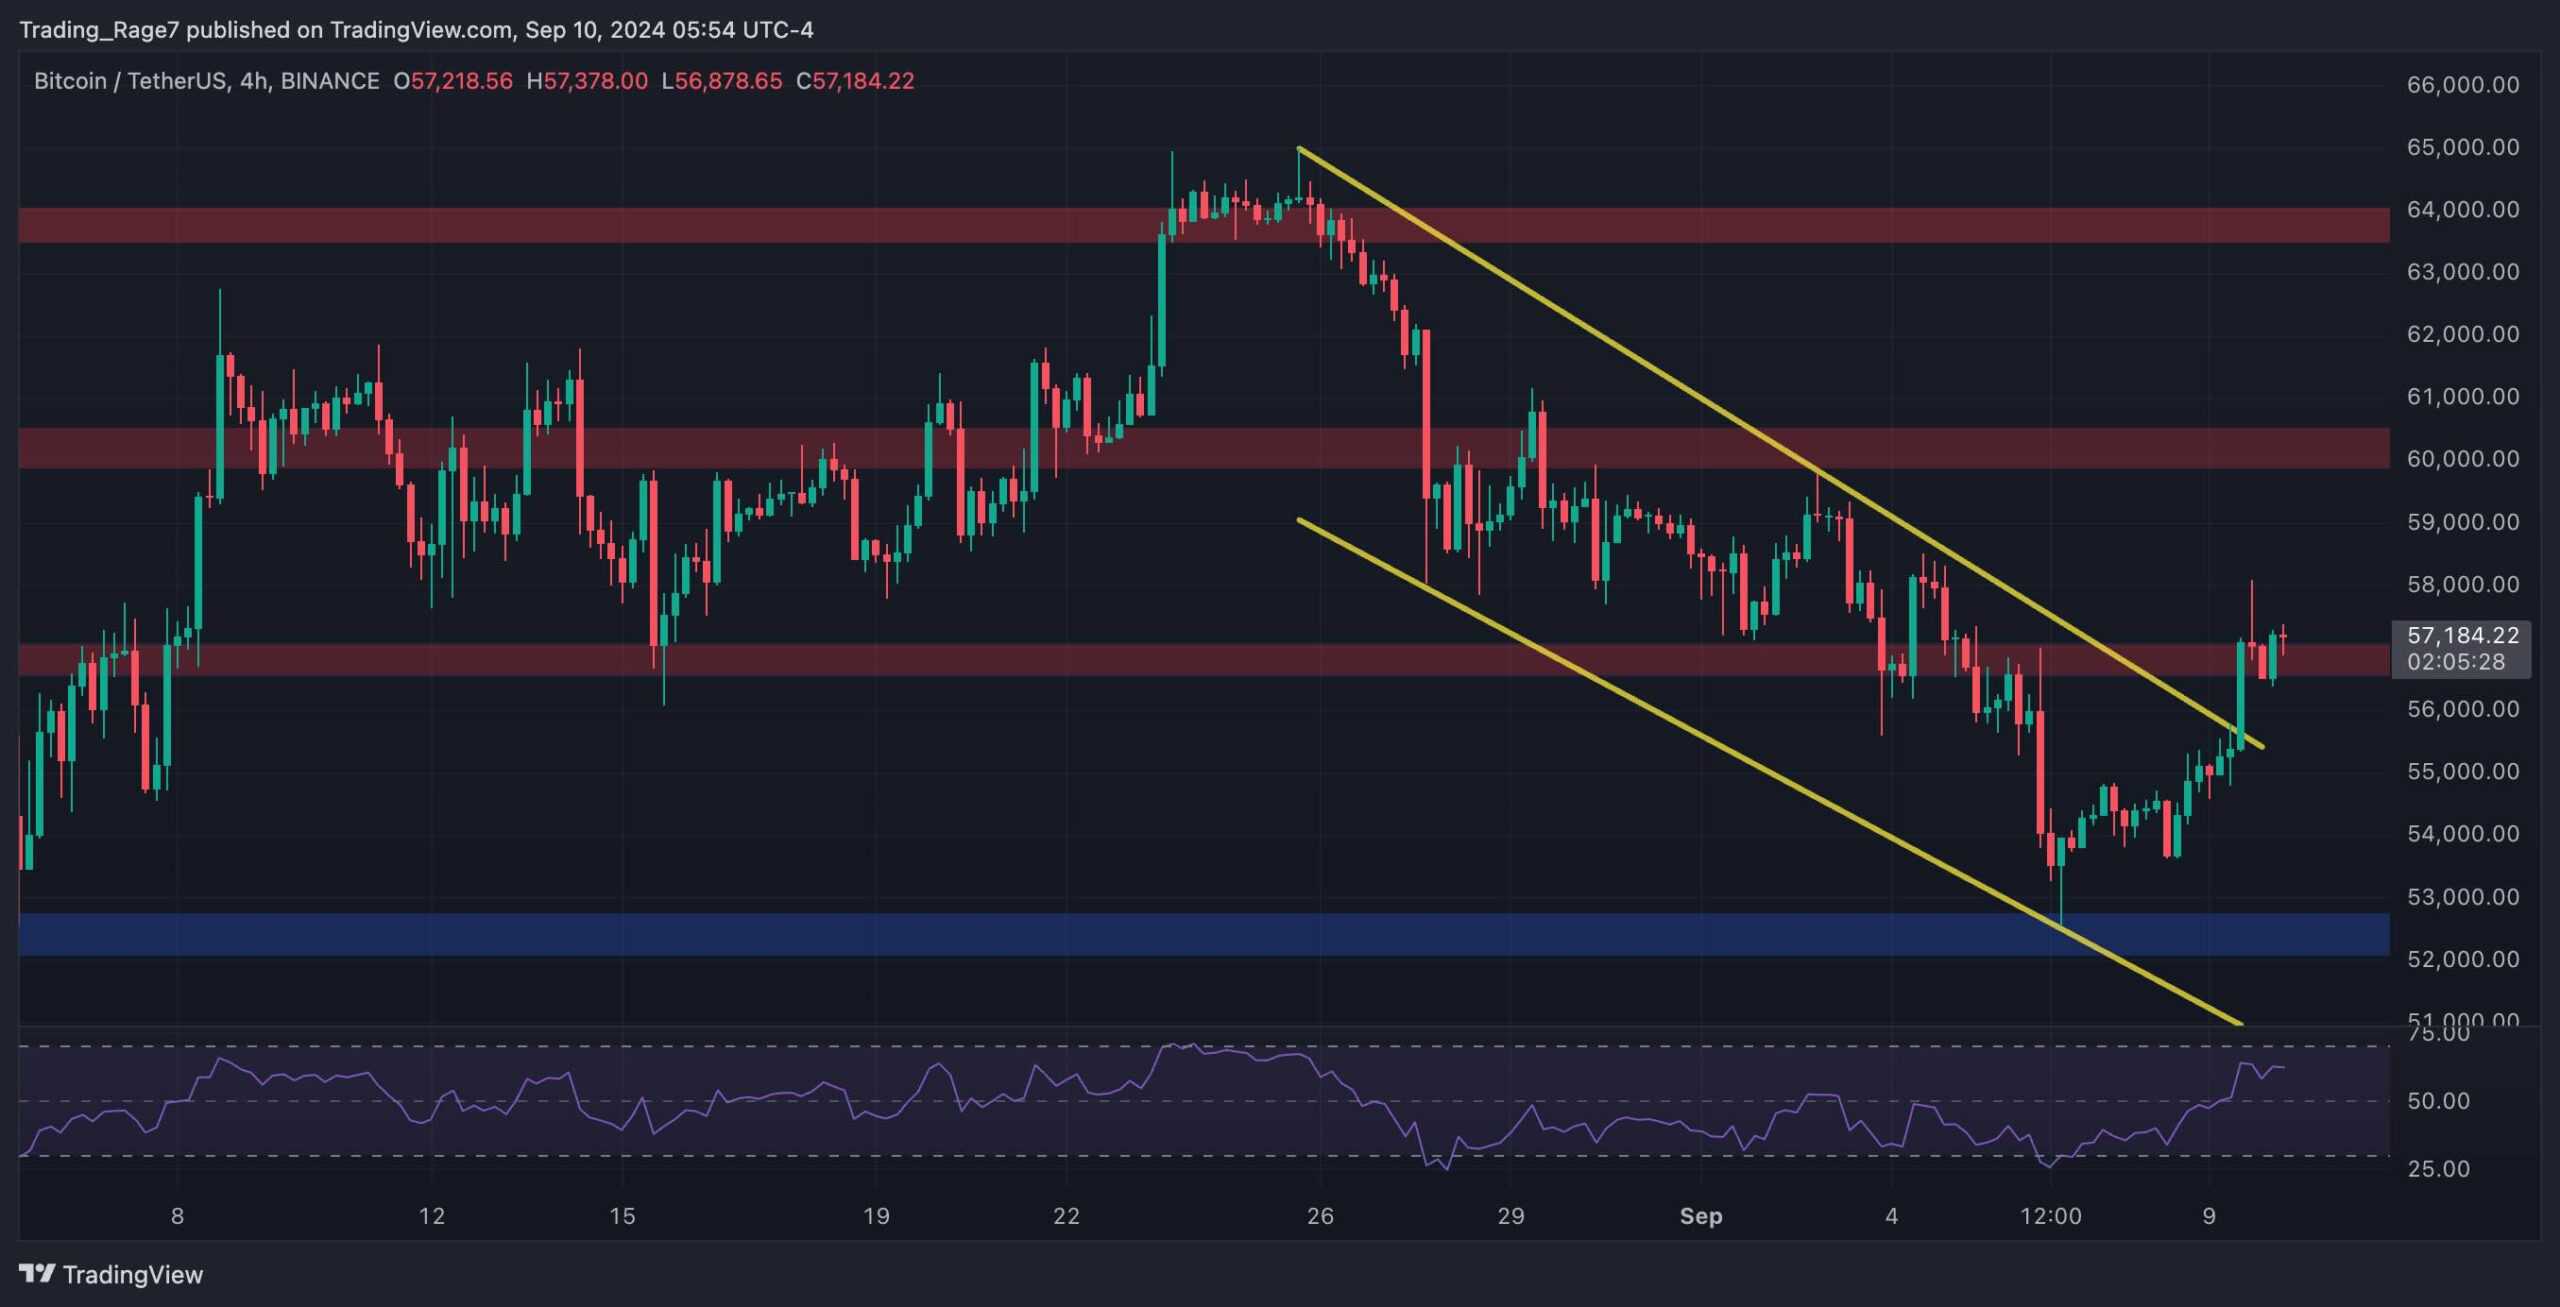
In the 4-hour timeframe, it is evident that the price has been declining inside a descending channel. Yet, the market has broken above the channel recently, and a rally toward the $60K level is likely in the short term.
This is, of course, if the breakout is valid and the market does not quickly drop back inside the channel. With the RSI also showing bullish momentum in this timeframe, a rally higher is highly probable.
On-Chain Analysis
By Edris Derakhshi
Bitcoin Long-Term Holder SOPR
In the Bitcoin network, long-term holders usually possess the majority of the supply. As a result, analyzing their behavior could be highly beneficial for understanding the market supply and demand dynamic.
This chart presents the 30-day moving average of the Long-Term Holder SOPR metric, which measures the ratio of realized profits/losses by long-term BTC holders.
As the chart suggests, the LTH-SOPR has been declining since the market’s failure to break above the $70K level. This demonstrates profit-taking behavior by long-term holders when the price is declining. If this trend continues, the subsequent selling pressure can lead to even more downtrend for the price.
The post This Is BTC’s Next Target After Surging 4% Daily: Bitcoin Price Analysis appeared first on CryptoPotato.