This Indicator Suggests There Might Be More Pain to Come for Bitcoin
The cryptocurrency market slumped over the past week, approaching a total capitalization of $1 trillion. This happened as Bitcoin lost about 14% since August 15th and currently struggles above the $21,000 mark.
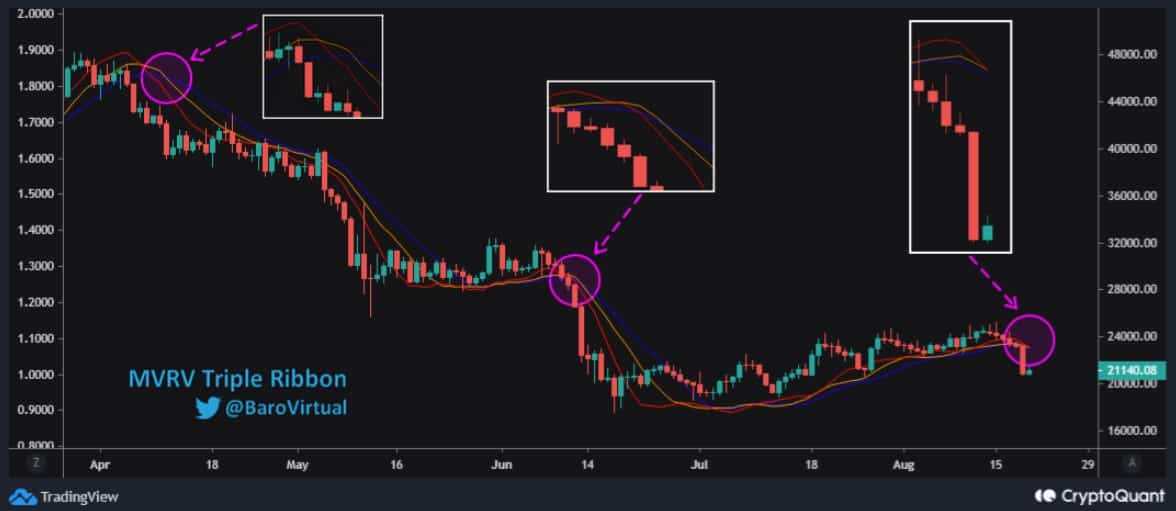
However, according to a popular indicator that’s commonly used to gauge the average price of BTC over a span of a few different time periods, there’s more pain to come.
- Bitcoin’s price dropped from around $25,000 to where it currently trades at around $21,500. This represents a decline of slightly less than 14% in eight days.
- One popular indicator, however, suggests that there might be more pain to come and that the worst hasn’t yet passed.
- Commenting on the matter was a CryptoQuant analyst who said:
Bitcoin MVR Tripple Ribbon (consists of 3MAs) again froms another signal, foreshadowing the fall of Bitcoin. This year, hypothetically, this will be the 5th full-fledged signal indicating the weakness of Bitcoin and a further sell-off. On average, this year, a similar signal led to the sell-off of Bitcoin by 30%.
- The Bitcoin MVR Tripple Ribbon consists of three moving averages – the 10-day, the 15-day, and the 20-day MAs.
- At the time of this writing, the indicator is on the verge of a crossover that has previously suggested an average decline of 30%. If it plays out the same, this would take the BTC price far below $20K.
The post This Indicator Suggests There Might Be More Pain to Come for Bitcoin appeared first on CryptoPotato.