These Are the Two Challenges for XRP Following 30% Recovery in 9 Days (Ripple Price Analysis)
Ripple has experienced a 30% recovery in the last nine days. The bulls have taken control of the market in the short term. But the main question is whether the bearish market can be considered over for the mid-term?
Technical Analysis
By Grizzly
The Daily Chart
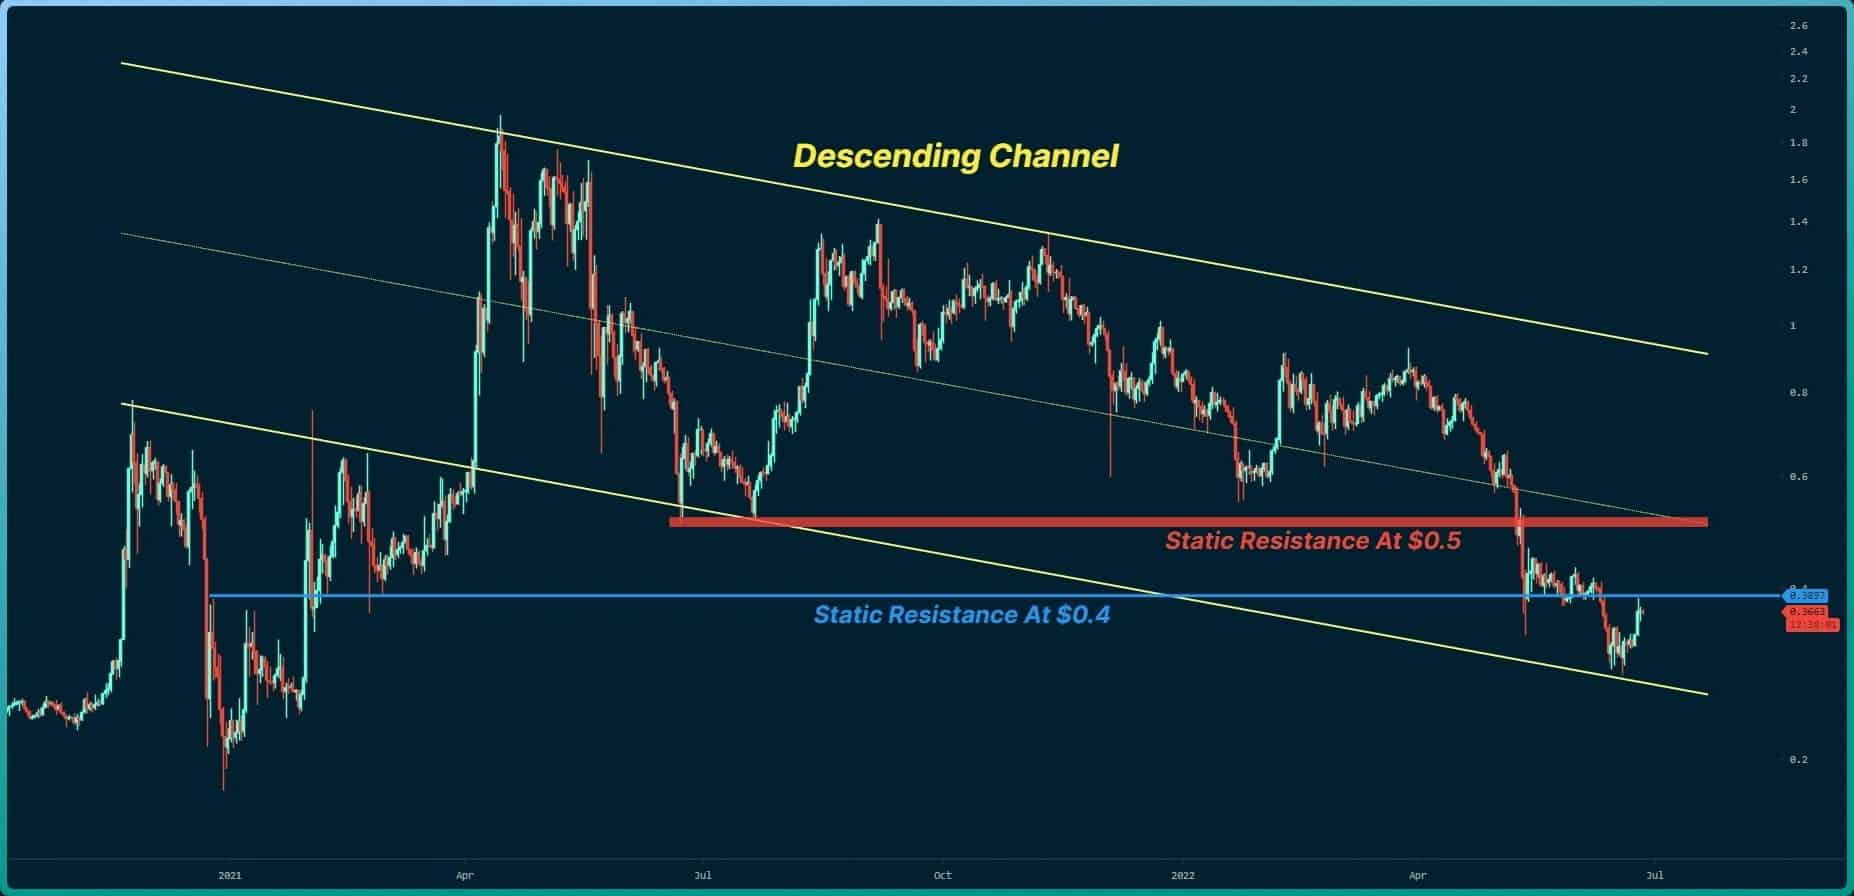
On the daily timeframe, XRP moves downward within a descending channel (in yellow). The bottom of this channel is currently acting as support, preventing further price declines. The short-term buying pressure has pushed the price towards the horizontal resistance at $0.4 (in blue). The bulls are facing two challenges:
1- Breaking the horizontal resistance at $0.4.
2- Breaking the critical horizontal resistance at $0.5 (in red), which intersects with the channel’s midline.
To claim the second resistance, buyers must be able to increase the price by 40%. If this happens, it remains to be seen if buyers have enough capital to maintain the price above $0.5. In this case, liquidating the short positions will accelerate the bullish trend.
On the other hand, if bears regain control of the market, the recent uptrend has been nothing more than a dead cat bounce.

Key Support Levels: $0.32 & $0.22
Key Resistance Levels: $0.40 & $0.50
Moving Averages:
MA20: $0.34
MA50: $0.39
MA100: $0.56
MA200: $0.80
The XRP/BTC chart
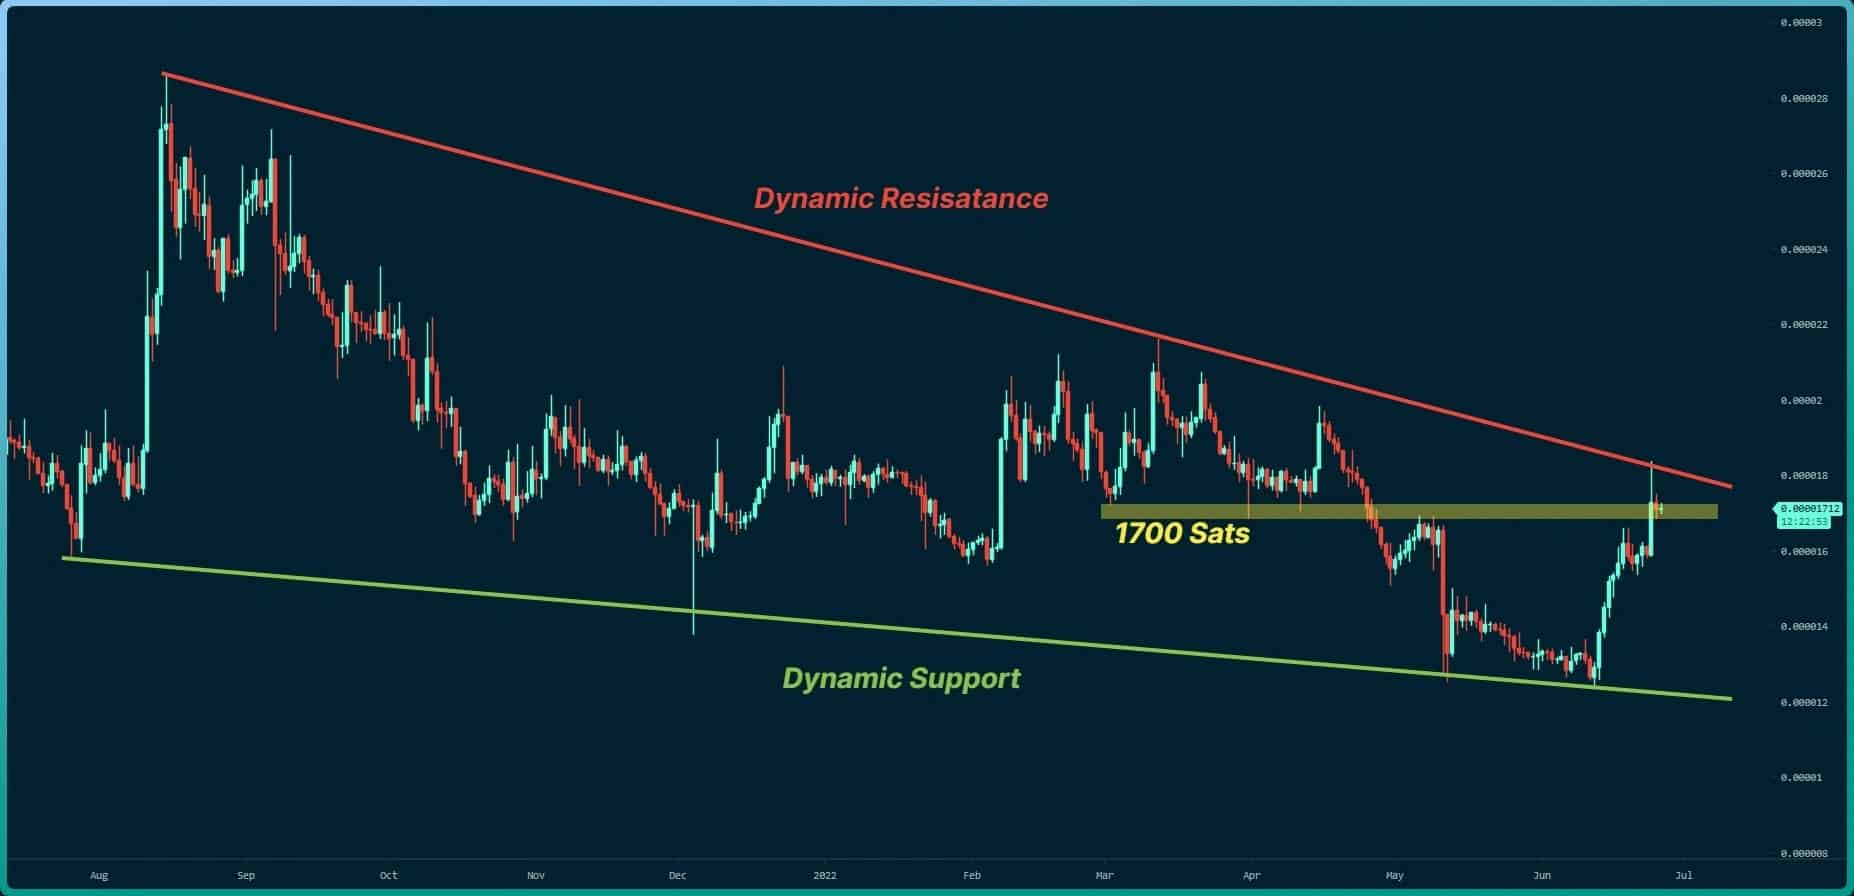
Against Bitcoin, XRP has performed even better, charting gains upwards of 45% in two weeks. The price has also broken the critical resistance at 1700 Sats (in yellow). Presently, the dynamic resistance (in red) has prevented the bulls from pushing forward.
If buyers succeed in crossing this area, it will be easy to reach 2000 Sats. If that’s the case, the bearish trend of late might be challenged.

Key Support Levels: 1700 Sats & 1550 Sats
Key Resistance Levels: 1800 Sats & 2000 Sats


