The Horror Prediction: Bitcoin is Likely To Re-test $3000 Before Turning Bullish Again
So far, 2018 has been a very bearish year for Bitcoin and the entire crypto market. Bitcoin’s price has dropped 70%, which is a long way down from its peak. The good news is that corrections are part of a long-term positive trend-line. The bad news is that according to some of the analysis we’ve conducted, Bitcoin’s bottom could be a lot lower than what we’ve seen so far. To be specific, the bottom could be around the $2,700 – $3,000 area. The analysis we’ve produced is based on technical analysis data and metrics. It can’t predict substantial fundamental news events.
Also, the following presents a possible scenario. This is likely to happen according to the analysis, but things might change at any moment.
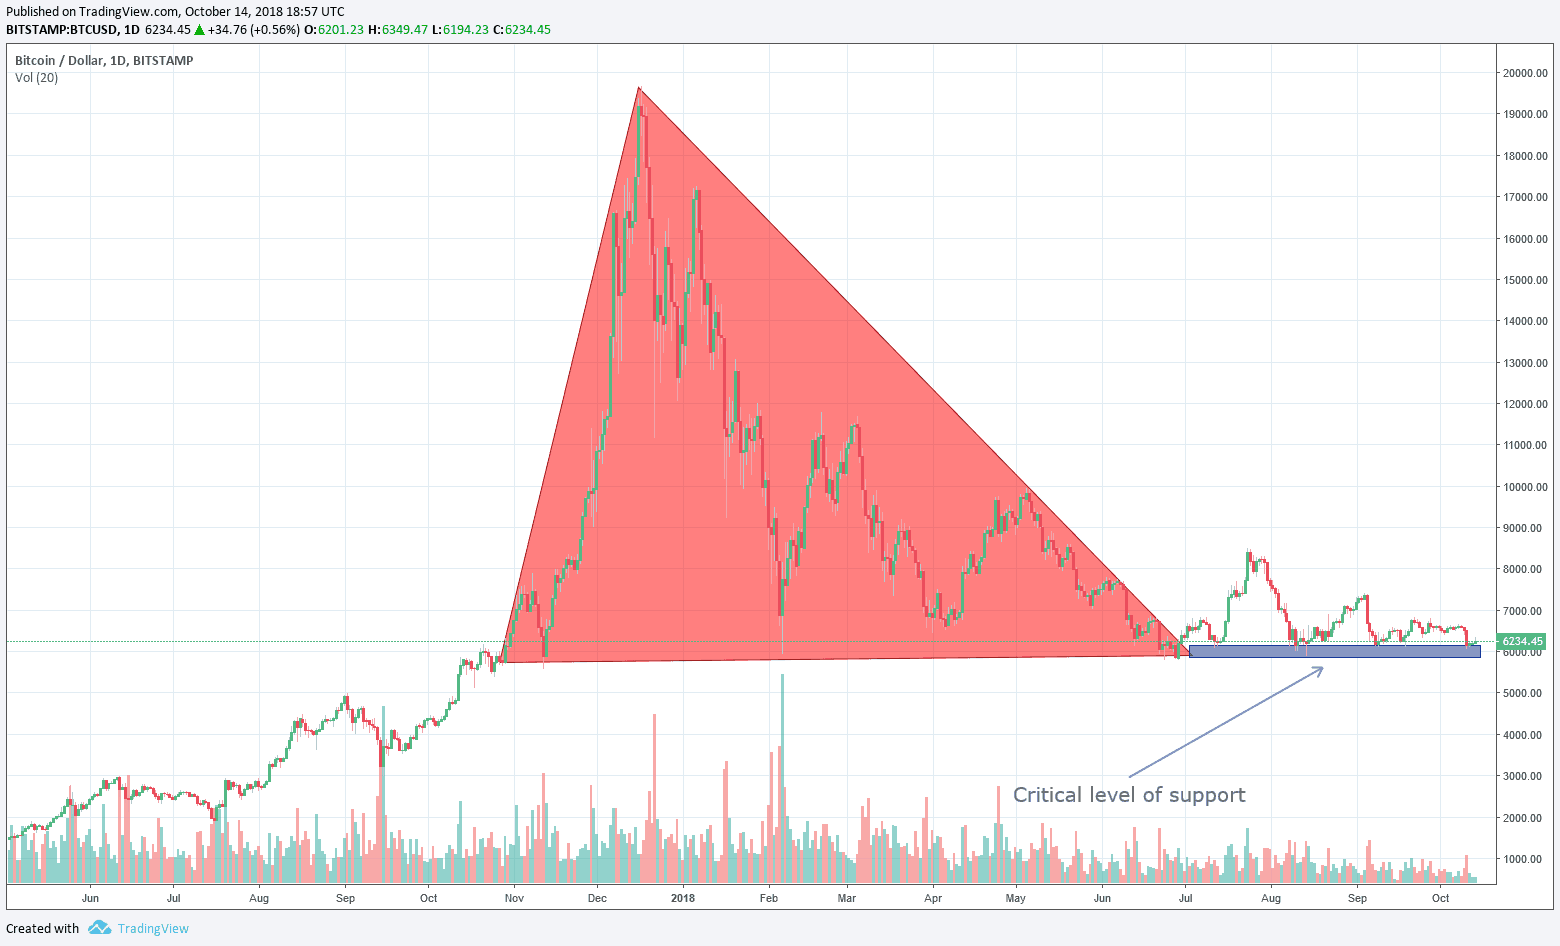
The famous 2018 Bitcoin triangle
To understand the current long-term situation for Bitcoin, let’s first look at the definition of a Symmetrical Triangle Pattern:
Triangles occur in bear and bull market conditions. Since they are continuation or reversal patterns, traders wait for the triangle to form and breakout to indicate the market’s direction. To develop a triangle, there has to be a minimum of two highs, and two lows which are touching each angle.
What about the estimated target in the case of a breakout? The height of a triangle at its base provides some clues to the value that might run following the break of a triangle. To induce this estimate, add the height of the angle to the point of a breakout in the same direction.

Technically, Bitcoin is at a very fragile point. Bitcoin is in a situation where if the triangle breaks down it might reach a target as low as the long-term log trend-line is located. This is somewhere between $2,700 – $3,000.
We are not here to create panic, but many indicators show a high-probability of this because usually in such triangles when the support touches their bottom several times, the support does not hold at the end.
If the support rises, i.e., higher lows, it indicates an upward direction of the market; which we do not find in the current Bitcoin situation.
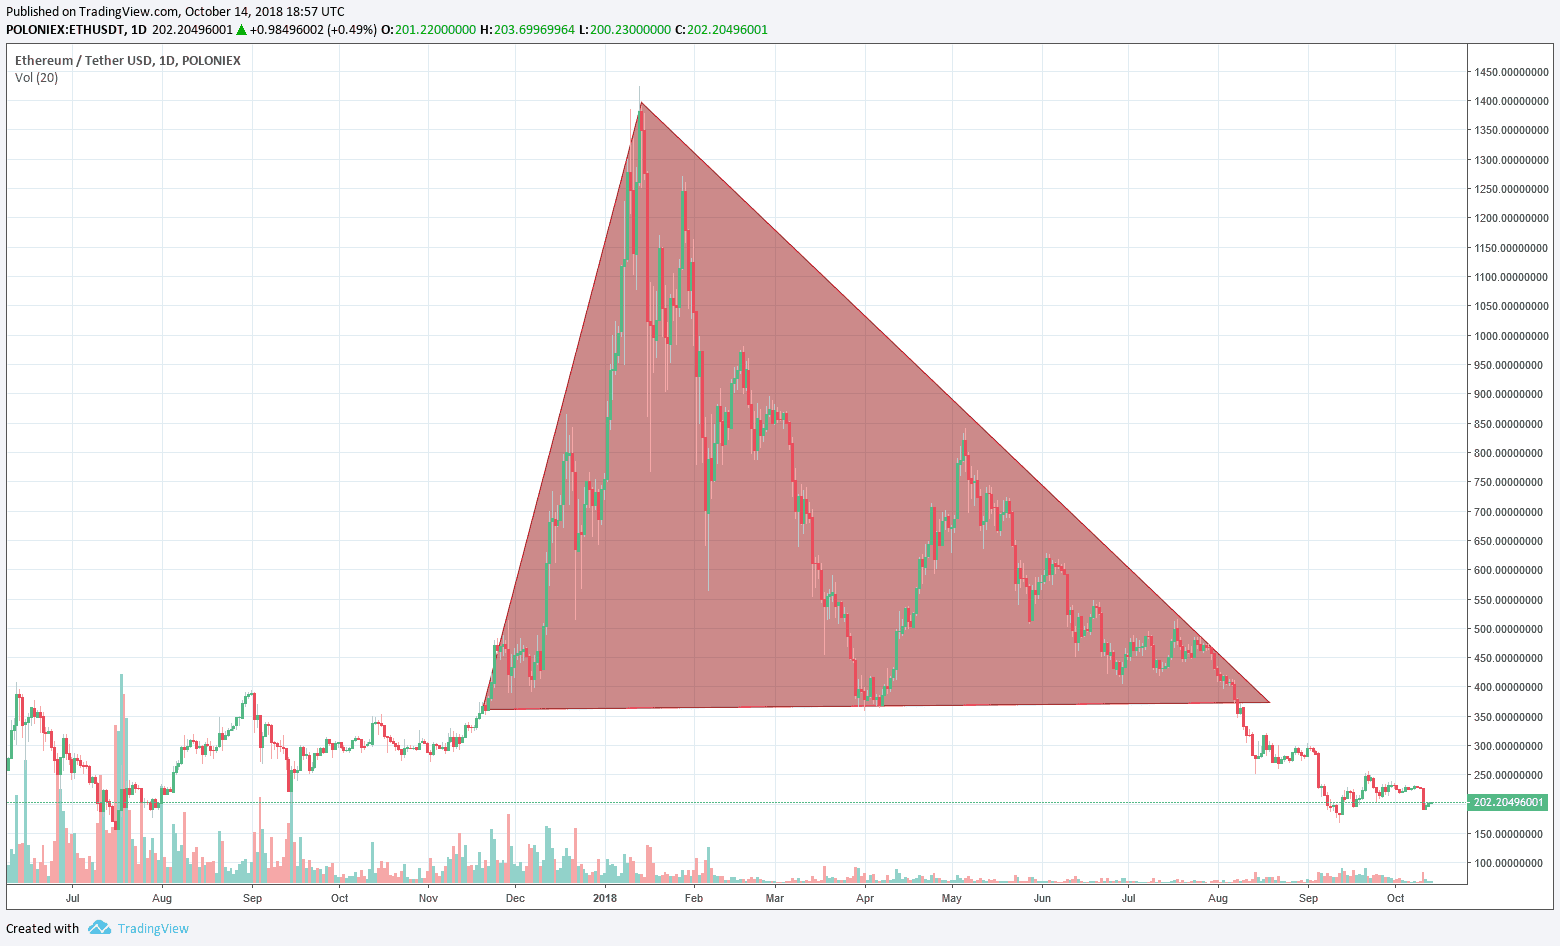
Ethereum example: Breaking down a symmetrical triangle
For some traders, the ETH chart is reminiscent of the Bitcoin bubble of 2013. The asset rose quickly from around $170 to $1,200/$1,400, and as the triangle broke – the lowest point was around $180 in both cases.
The following chart shows the triangle, which is marked by a red background. The critical support area for ETH at $380 – $400 had broken down: The current low of ETH lies around $170 (September 12):
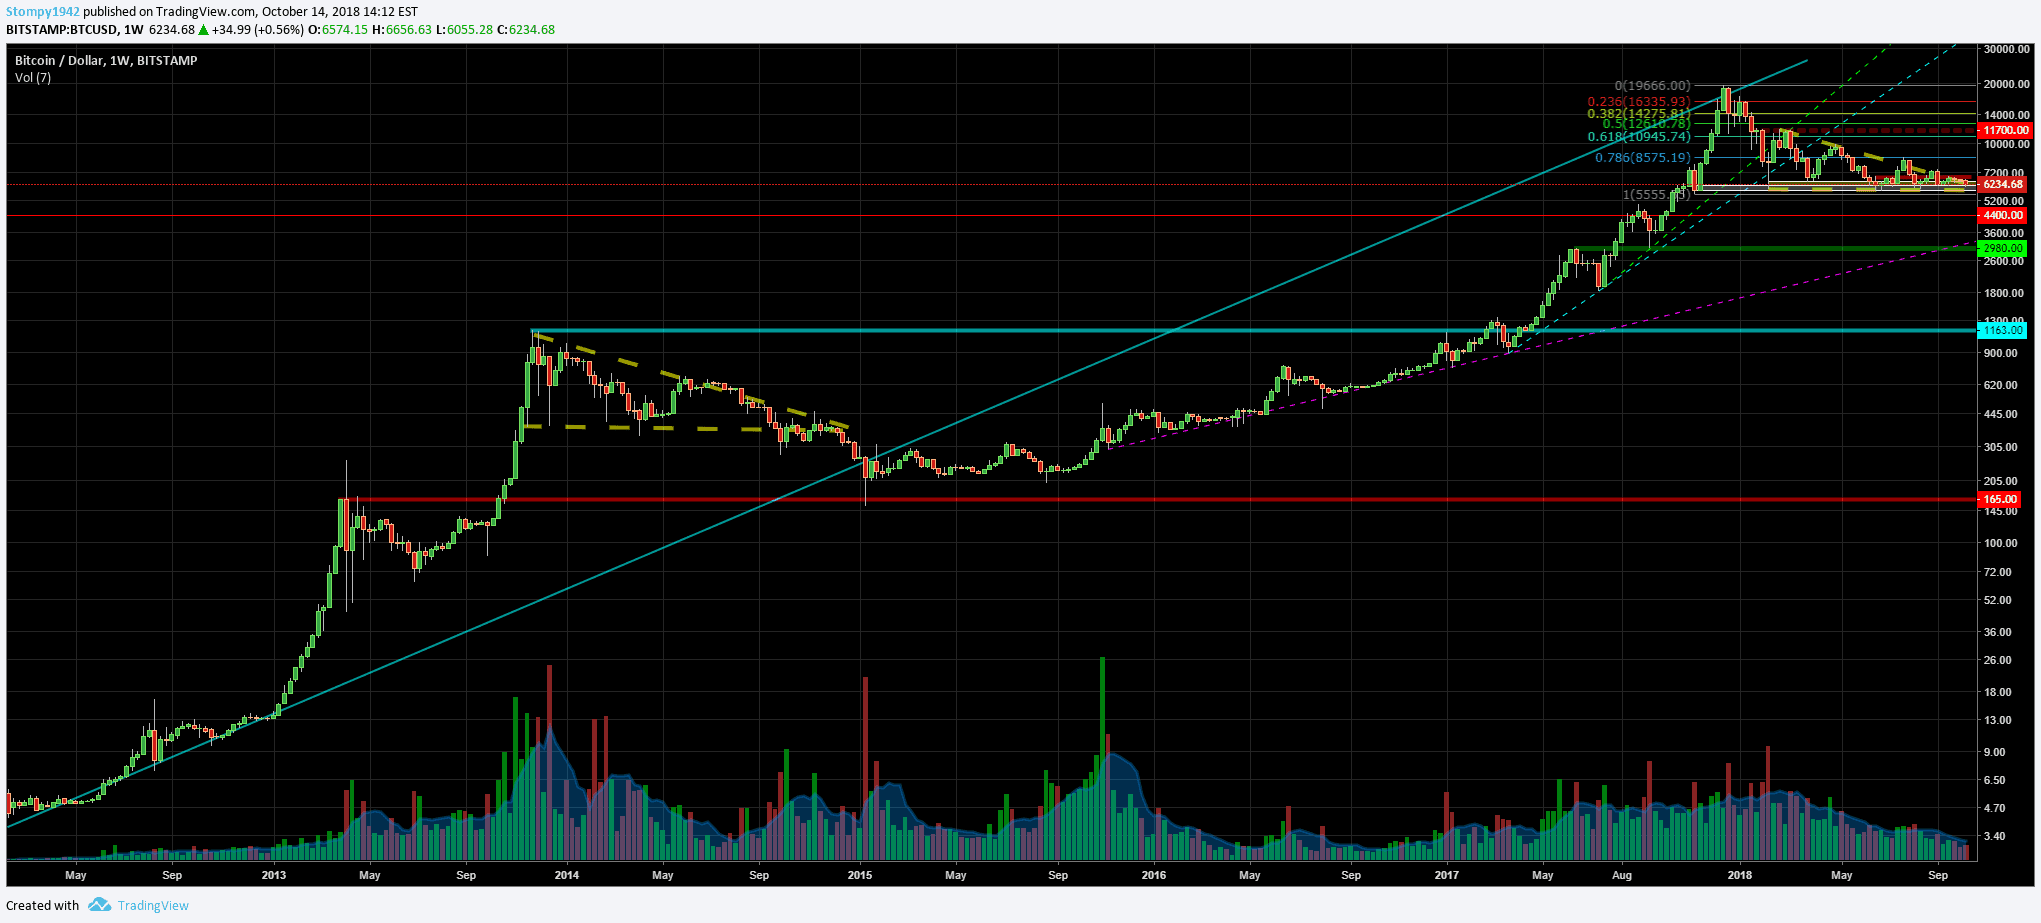
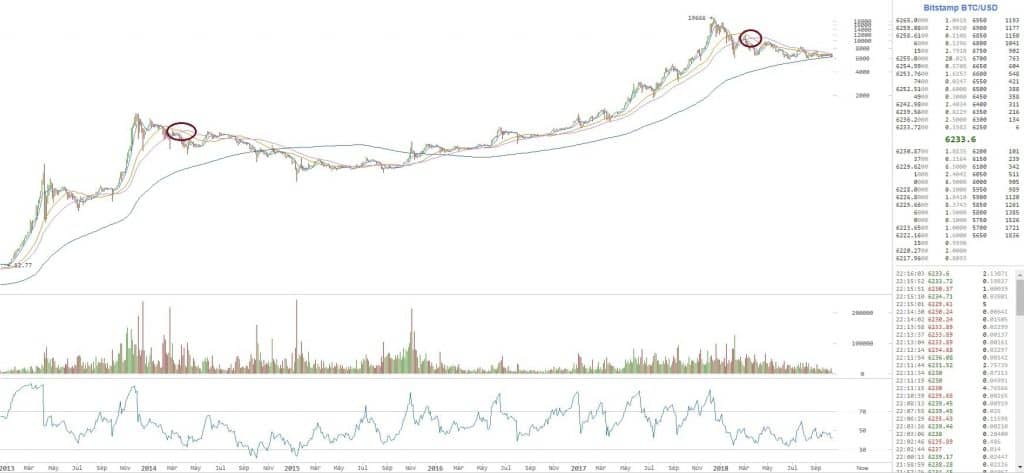
The Bitcoin long-term LOG chart
Even in the long-term logarithmic chart compared with the correction that followed the crypto bubble of 2013, we can see that there is still room for a major move down, indicating the above targets.
Most of the market believes that the support around $6,000 will hold for Bitcoin. The recent sharp drop on Wall Street also did not have a positive effect on the crypto market, which usually reacts accordingly. In contrast, commodities and gold have risen – indicating the weakness of the markets.
Price differences between BitFinex and the rest of the market and the weakness of Tether are other factors that indicate recent market instability.
Trading volume has dropped significantly, and it seems that the recent months do not represent the actual value of Bitcoin. Most of the trading volume is created and dominated by individual Bitcoin whales.
Also, by looking at the moving average lines of the long-term Bitcoin chart, we can examine the similarities:
As mentioned, the above presents the bearish long-term scenario for Bitcoin, it is limited only to the author’s view and is not a trading advice in any manner.
The post The Horror Prediction: Bitcoin is Likely To Re-test $3000 Before Turning Bullish Again appeared first on CryptoPotato.