The Ethereum Golden Cross: A Break Above $142 Could Send ETH Toward $170 – Price Analysis March 8
Ethereum has been trading sideways over the previous week as the market attempts to break clearly above the $140 resistance level. Despite the recent stagnant market movement, the coin is still up by a total of 28% over the past 30 days and up 53% over the past 90 days.
Ethereum currently holds a $14.46 billion market cap value which places the coin in the second position amongst its rival Ripple. The market had recently undergone a significant network upgrade, however, price action is still yet to see a substantial reaction from this event. This might take place after investors witness the improvements to the scalability of the Ethereum blockchain.
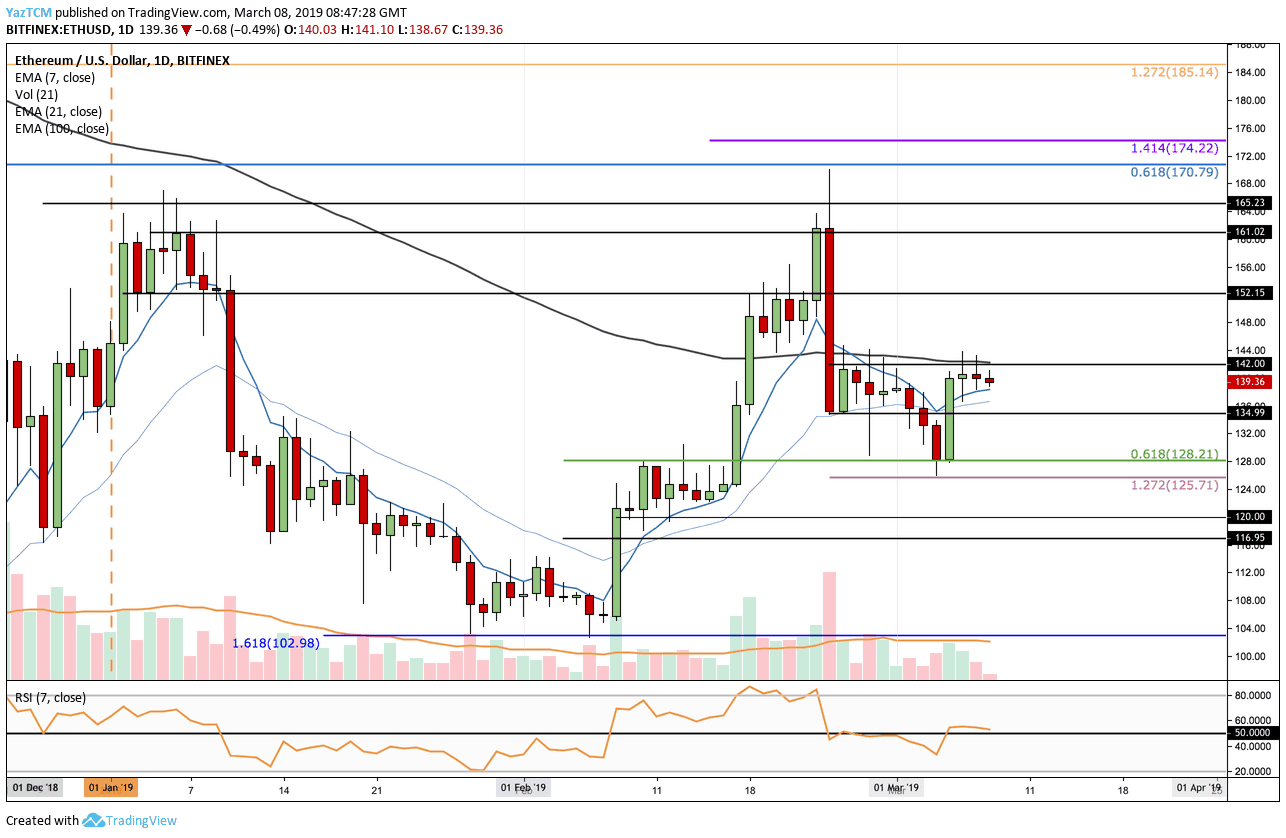
Looking at the ETH/USD 1-Day Chart:
- Since our previous Ethereum price analysis, we can see that the market had rebounded from the support at the $128 level at the .619 Fibonacci Retracement level. After bounding, the market went on to rise into resistance at the $142 level and has failed thus far in breaking above this resistance.
- From above: The nearest resistance above $142 lies at the $152 and $161 levels. Further higher resistance then lies at $168 and at $170 where lies the bearish .618 Fibonacci Retracement level.
- From below: The nearest support lies at $135. Support beneath $135 lies at $128 where the .618 Fibonacci Retracement is located. Support beneath $128 can be expected at $125, $120 and $116.
- The RSI continues to trade along the 50 level as the bulls and bears battle for momentum within the market.
- The trading volume has been decreasing during March.
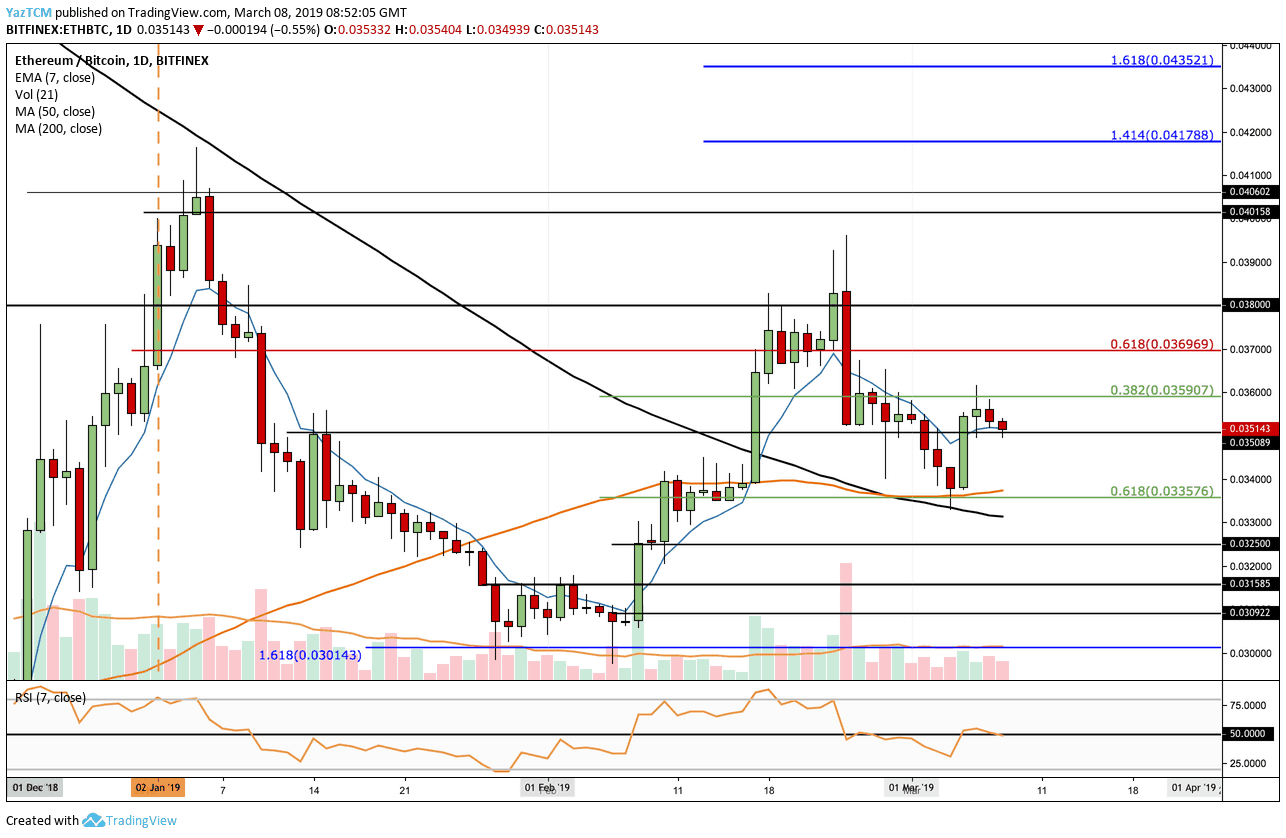
Looking at the ETH/BTC 1-Day Chart:
- We can see that ETH/BTC had held support at 0.03357 BTC following our previous analysis. The market then went on to rise into resistance at 0.03590 BTC where lies the .382 Fibonacci Retracement level. Price action is now trading above support around the 0.035 BTC level.
- One noteworthy observation is the recent cross of the 50-days moving average line (marked in orange) above the 200-days moving average line (marked in black). Known by the term of Golden Cross, and usually is a very bullish long-term signal.
- From above: The nearest resistance lies at 0.03590 BTC. Further resistance above is then located at 0.03696 BTC and 0.038 BTC. If the bulls can break above 0.038 BTC, then further resistance lies at 0.040 BTC.
- From below: The nearest support lies at 0.03357 BTC. The 50 MA also lies here bolstering the support. Further support below this lies at 0.0325 BTC, 0.03158 BTC, and 0.030 BTC.
- The RSI is also trading along the 50 level which shows the indecision within the market.
- The trading volume has also decreased in the first week of March.
The post The Ethereum Golden Cross: A Break Above $142 Could Send ETH Toward $170 – Price Analysis March 8 appeared first on CryptoPotato.


