The Effect Of Sentiment On The Bitcoin Price
Social sentiment is often correlated to the bitcoin price and can have a snowball effect for price movements, both to the upside and downside.
Dang Quan Vuong is a trader and market analyst at King Stock Capital Management.
Potential new investors who have lately joined the Bitcoin network have expressed social interest in the asset. Whether you’re selling or buying bitcoin, your actions inherently have an impact on whale behavior. In this article, we’ll focus on how social sentiment affects whale behavior and how it connects to price volatility.
Looking at social volume (the sum count of content that mentions Bitcoin-related terms at least once, particularly on Reddit, Twitter and Telegram), we can see that social volume and bitcoin price has a positive correlation. So, what exactly is the justification for this phenomenon?
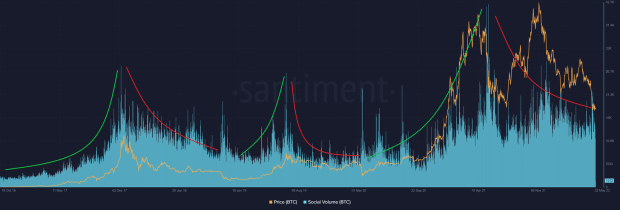
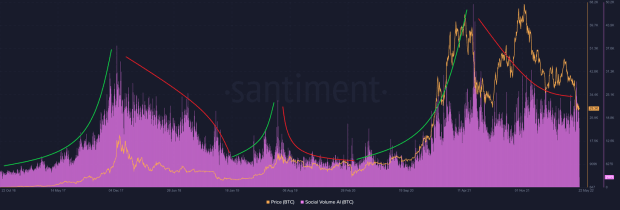
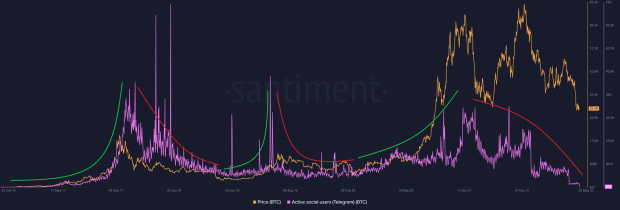
Accordingly, Google Trend data suggests that rising social volume has piqued public curiosity and prompted them to conduct their own searches for bitcoin. It shows that the amount of bitcoin mentions and references on social media is connected to public interest in bitcoin and may have influenced the public’s investment decisions.

As evidenced by the number of unique active addresses and transaction volume, social sentiment has an impact on the entire network activity. The daily cumulative count of unique addresses, including senders and receivers, is proportional to social volume, although there is a significant divergence when bitcoin is close to a bottom.
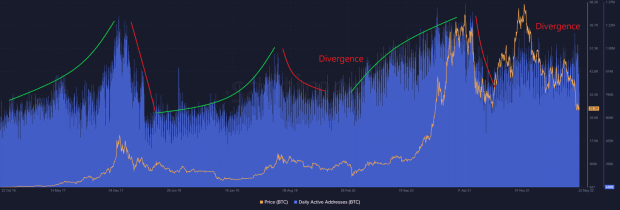
Similarly, as market participants become more active during an uptrend from the bottom, the total amount of bitcoin sent over the network in a given interval often increases, while it remains relatively low during a downtrend.
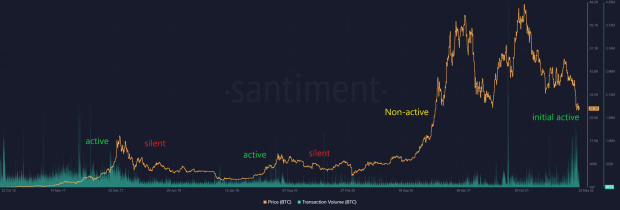
Trading volume directly reflects bitcoin’s price as a result of heightened activity, and investors behave more aggressively during bull runs and less aggressively during bear markets.

In social psychology, the snowball effect is a process that begins with a minor state and progressively grows in significance or size. The vivid portrayal is when a snowball rolls down a snow-covered mountainside, collecting additional snow, gaining more weight and momentum until it finally comes to rest. The spread of bitcoin on various social media platforms can have a similar effect, as more and more attention is given to it, causing bitcoin to gain increased public awareness and, in consequence, the snowball effect occurs. The higher the bitcoin price rises, the more publicity it receives, which again boosts buying momentum.
An upsurge in social media content would be a plausible reason for a group of traders and investors impacting the bitcoin price. They go to buy bitcoin and are confronted with stimulating content from social media. This would draw greater attention to the positive aspects of Bitcoin and make more people aware of it. The euphoria grows as more individuals enter the market. More and more people become involved as a result of the increased attention and the cycle continues over and over again.
The market continues to rise until it reaches a critical point where it stays in a condition of equilibrium and no longer rises due to a lack of buying impetus. It is because reduced social interest marks the maximum of upwards momentum and the start of a downward trend thereafter.
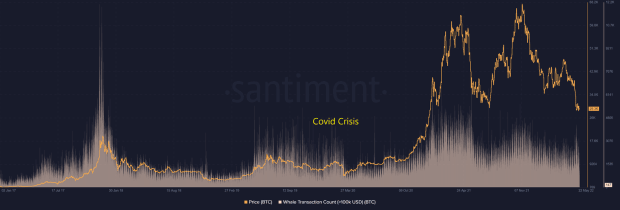
Whales, as many know, play a pivotal role in market movement because they have the ability to drive bitcoin’s price, so it’s important to determine when they enter the market. As shown in the following figures, the total number of whale transactions over $100,000 and $1 million rises in the rally and falls in the decline. The charts reveal that whales are more active during uptrends and less active in downtrends except for the panic sell in the COVID-19 pandemic.

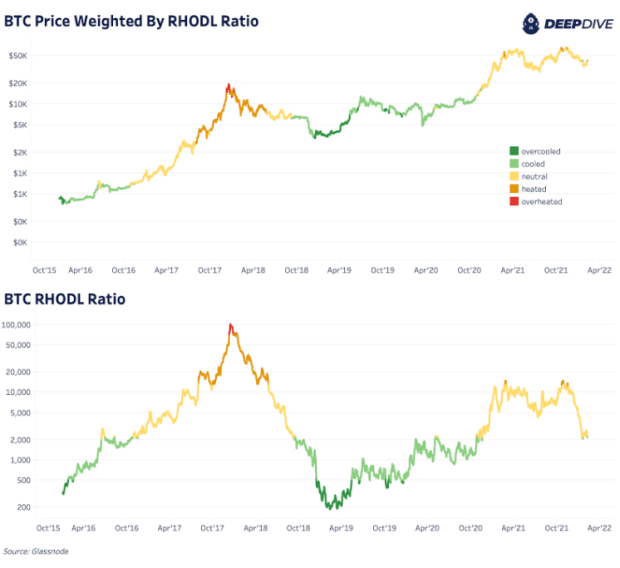
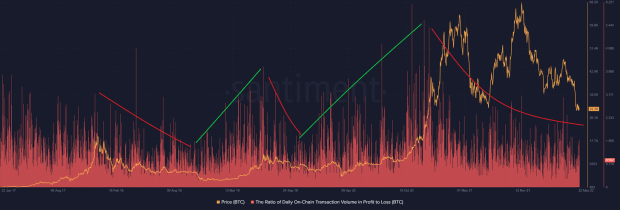
In a specific interval of time, the ratio of total coins transferred in profit to total coins transferred in loss grows in uptrends and drops in downtrends. It means that profit increases during an upswing until it reaches its peak. Then it goes down until most investors are in the red, at which point the trend reverses.
In summary, the premise of upswing momentum is the growing social sentiment as new investors eagerly enter the market. This self-fulfilling prophecy has historically been attributed to the acceleration of traded volume. When the Bitcoin community thinks the market will move higher in an uptrend, more purchase orders are placed, causing the market to trend upward. Meanwhile, whales are likely to distribute their holdings to newcomers before forcing them to sell them at a loss after a period of time. As a result of the growing public interest, the network value expands until there is no more buying momentum and then bitcoin eventually gets dumped. This cycle is set up to repeat itself periodically.
This is a guest post by Dang Quan Vuong. Opinions expressed are entirely their own and do not necessarily reflect those of BTC Inc. or Bitcoin Magazine.

