The Calm Before The Storm? Bitcoin (BTC) Price Analysis & Overview May 22
Over the past three days since our previous price analysis and surprisingly, Bitcoin had set to keep up its price around the $8,000 area. For the past three days, we saw Bitcoin trading between the range of $7,800 to $8,000.
Regarding volatility, this is the opposite of what we saw during the first months of 2019. When Bitcoin is stable around a certain price, it’s instead be referred as the “calm before the storm,” or in other words – a strong move is likely to take place soon.
As always, the direction is unknown, but looking at the negative direction, this build-up can end up in a classic double-top, which is a bearish trading formation.
Total Market Cap: $249 Billion
Bitcoin Market Cap: $140.2 Billion
BTC Dominance: 56.3%
Looking at the 1-day & 4-hour charts
– Support/Resistance:
From above, Bitcoin still facing the $8000 resistance. If Bitcoin succeeds in breaking above, we would expect a retest of $8200 and 2019 high at $8400. The next possible targets or resistance levels are $8500, $8800 and $9000. Further resistance lies at $9600 – $10,000 area.
From below, the closest support lies at $7800. Below is the $7600, before reaching the prior support at $7200 – $7300 zone. Further below is the $7,000 area.
– Trading Volume: Following the above, we can clearly see that the volume decreases from day to day. This strengthens the possibility of a sharp move which is likely to show up.
– Daily chart’s RSI: The RSI had lost momentum and as of now trading around the 67 level. The last is still in the bullish territory, but very low compared to the past month. Stochastic RSI oscillator is at its low levels, however, yet not pointing above.
– BitFinex open short positions: Since the 40% daily drop a week ago (and the long squeeze right after), we saw the short positions gaining momentum slowly. As of now, there are 18.7K BTC open short positions, which is the 5-day high.
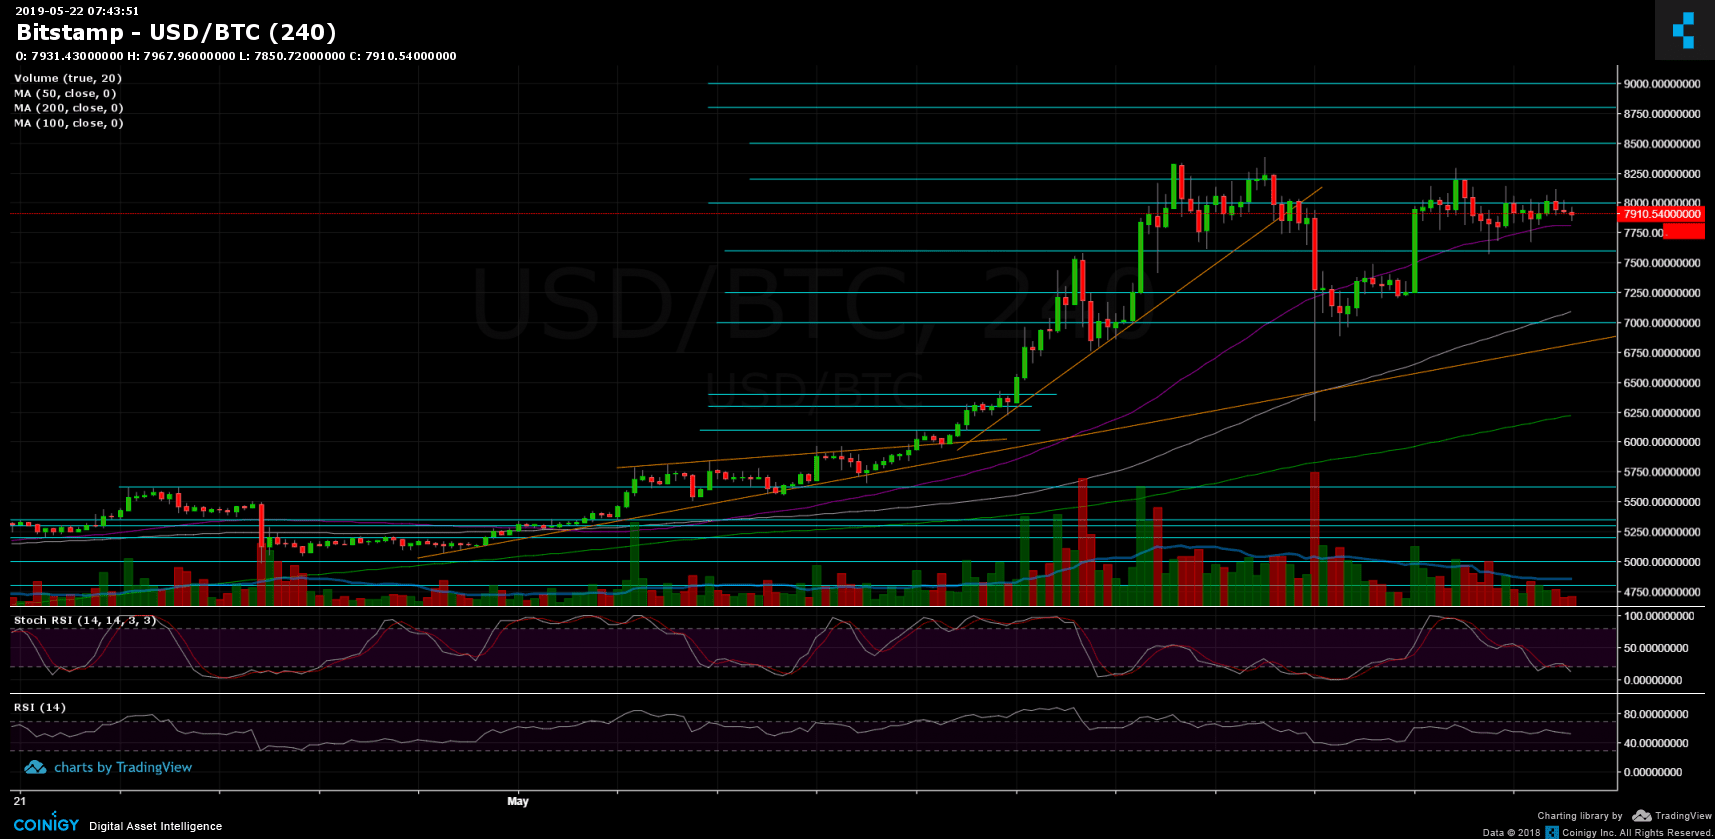
BTC/USD BitStamp 4-Hour Chart
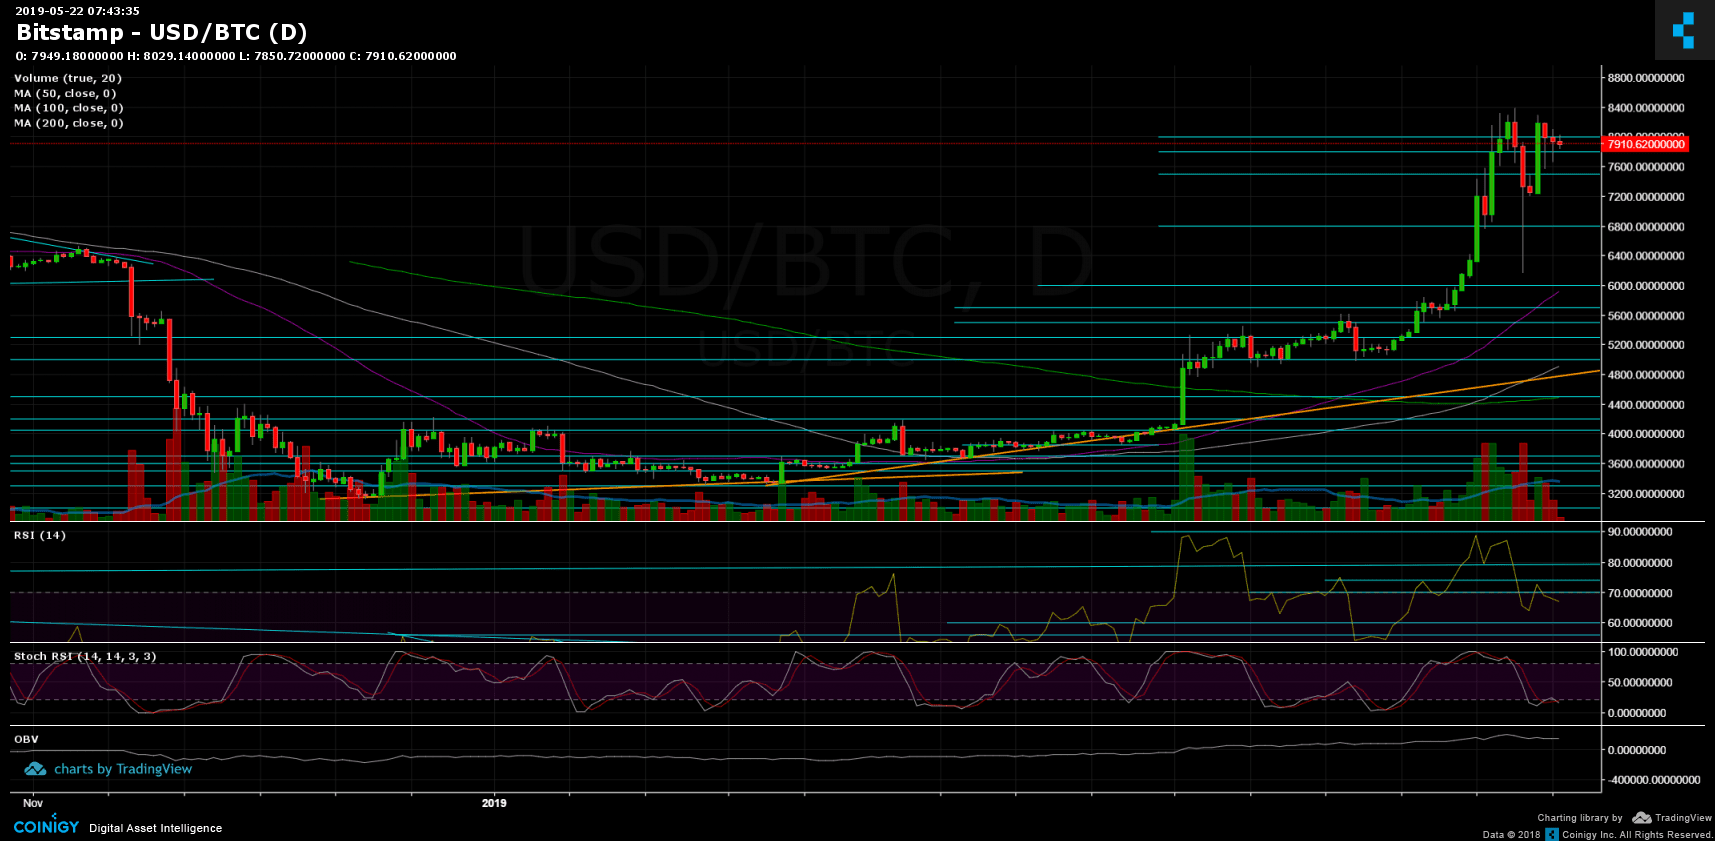
BTC/USD BitStamp 1-Day Chart
The post The Calm Before The Storm? Bitcoin (BTC) Price Analysis & Overview May 22 appeared first on CryptoPotato.