The Altcoin of 2019: Binance Coin Records Another All-Time High At $30. What Are The Next Targets? BNB Price Analysis
Binance Coin has seen another price increase, which totals around 8% over the past 24 hours of trading (as of now), BNB had even managed to reach $29.83 early today, creating a new all-time high, before the bullish pressure started to fade away.
After an extraordinary price explosion totaling 230% over the past 90 days, Binance Coin remains in the 7th place amongst the top cryptocurrency projects by market cap as it currently holds a $4.11 billion market cap.
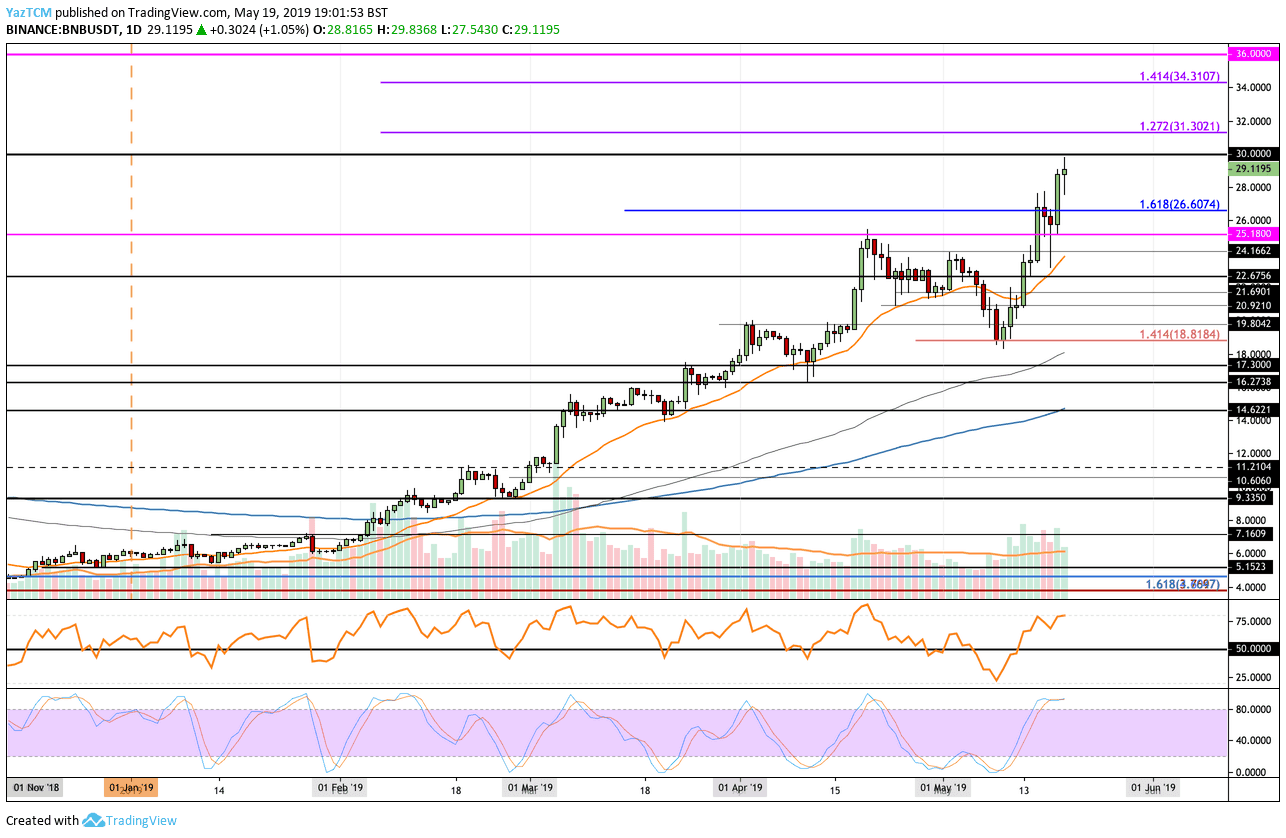
Looking at the BNB/USD 1-Day Chart:
- Against the US Dollar, we can see that since our previous BNB/USD analysis, Binance Coin has continued to gain momentum above the $21 support level and increased to where it is currently trades, around $29.
- From above: The nearest level of resistance now lies at the $30 psychological resistance level. Above $30, we can expect further resistance at $31.30 and $34.31, which is provided by the medium term 1.272 and 1.414 Fibonacci Extension levels. If the buyers continue above $35, we can expect further resistance at $36.
- From below: The nearest level of support now lies at $28 and $26. Further support lies at $25.18, $24.16, $22.67 and $21.69.
- The trading volume has managed to remain consistently high during May 2019 as the buyers continue their bullish momentum.
- The Stochastic RSI has now reached overbought conditions which could suggest that a pullback may take place over the next few days to give the buyers a little break. This is further confirmed by the RSI as it trades in the overbought territory.
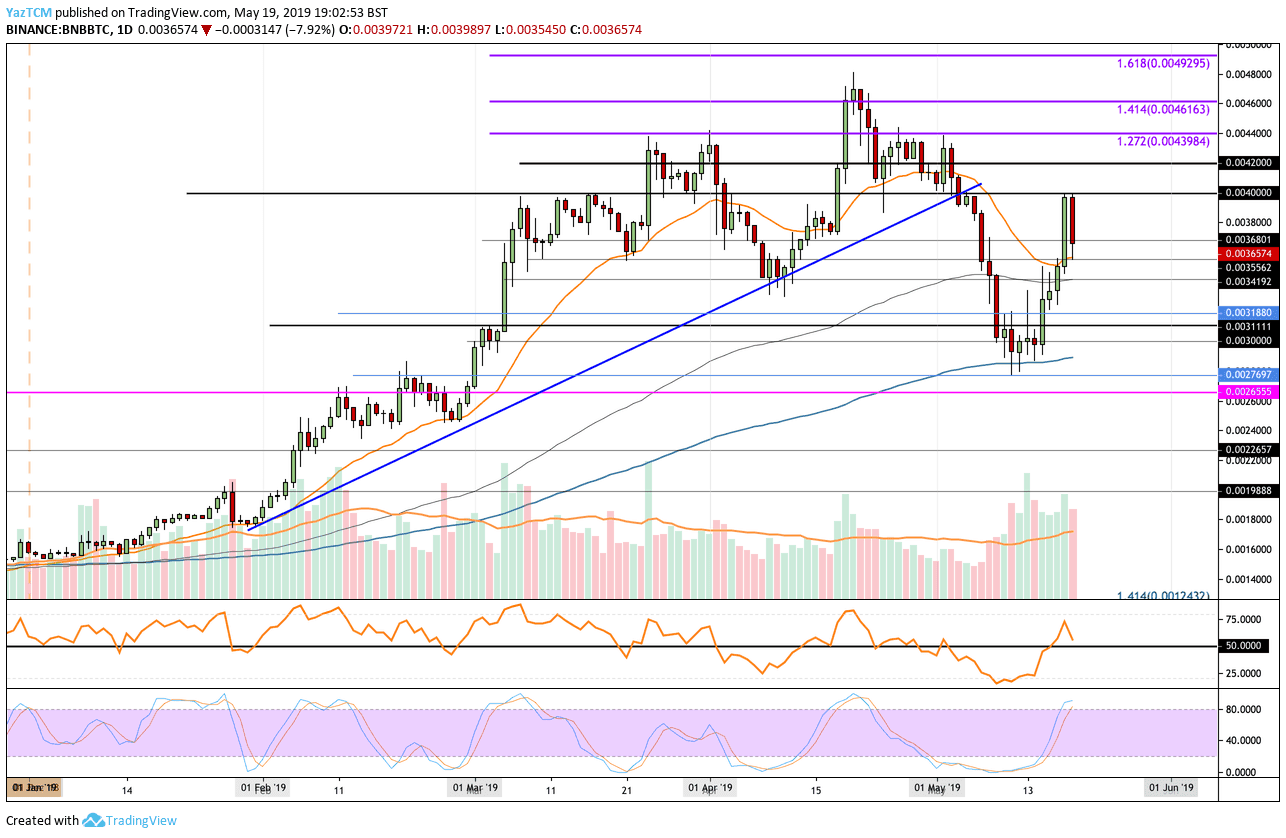
Looking at the BNB/BTC 1-Day Chart:
- Against Bitcoin, we can see that BNB/BTC continued to rebound from the support of 0.00277 BTC which was provided by the 200-days EMA. BNB has now rebounded higher up to the significant resistance at the 0.004 BTC level (highest level so far today).
- From above: The nearest levels of resistance lie at 0.0038 BTC and 0.0040 BTC. Higher resistance at 0.004398 BTC, 0.004613 BTC and 0.0048 BTC (BTC all time high).
- From below: The nearest level of support now lies at 0.0035562 BTC. Beneath this, more support lies at 0.003420 BTC, 0.003188 BTC and 0.003 BTC.
- The trading volume for BNB/BTC has also increased during May 2019.
- The Stochastic RSI has now also reached overbought territory which could suggest that a retracement might take place soon, before the coin continues further higher.
The post The Altcoin of 2019: Binance Coin Records Another All-Time High At $30. What Are The Next Targets? BNB Price Analysis appeared first on CryptoPotato.