Tether-Issued Stablecoin USDT’s Market Share Grows to 75% as Market Cap Tops $118B
-
USDT’s market share grew to 75% from 55% in the past two years, according to Token Terminal.
-
The Tether-issued stablecoin’s supply rose to $118 billion from $65 billion while main rivals struggled.
Tether’s USDT, the largest stablecoin, is not only growing larger, it’s also cementing its dominant position and now accounts for almost 75% of stablecoin market value, up from 55% two years ago, data by blockchain data analytics platform Token Terminal shows.
USDT supply nearly doubled in the period, growing to $118.6 billion of the $160 billion stablecoin market from around $65 billion, according to Token Terminal. It’s the third-largest cryptocurrency overall, trailing just bitcoin (BTC) and ether (ETH). The No. 2 stablecoin, Circle’s USDC, is less than a third of its size.
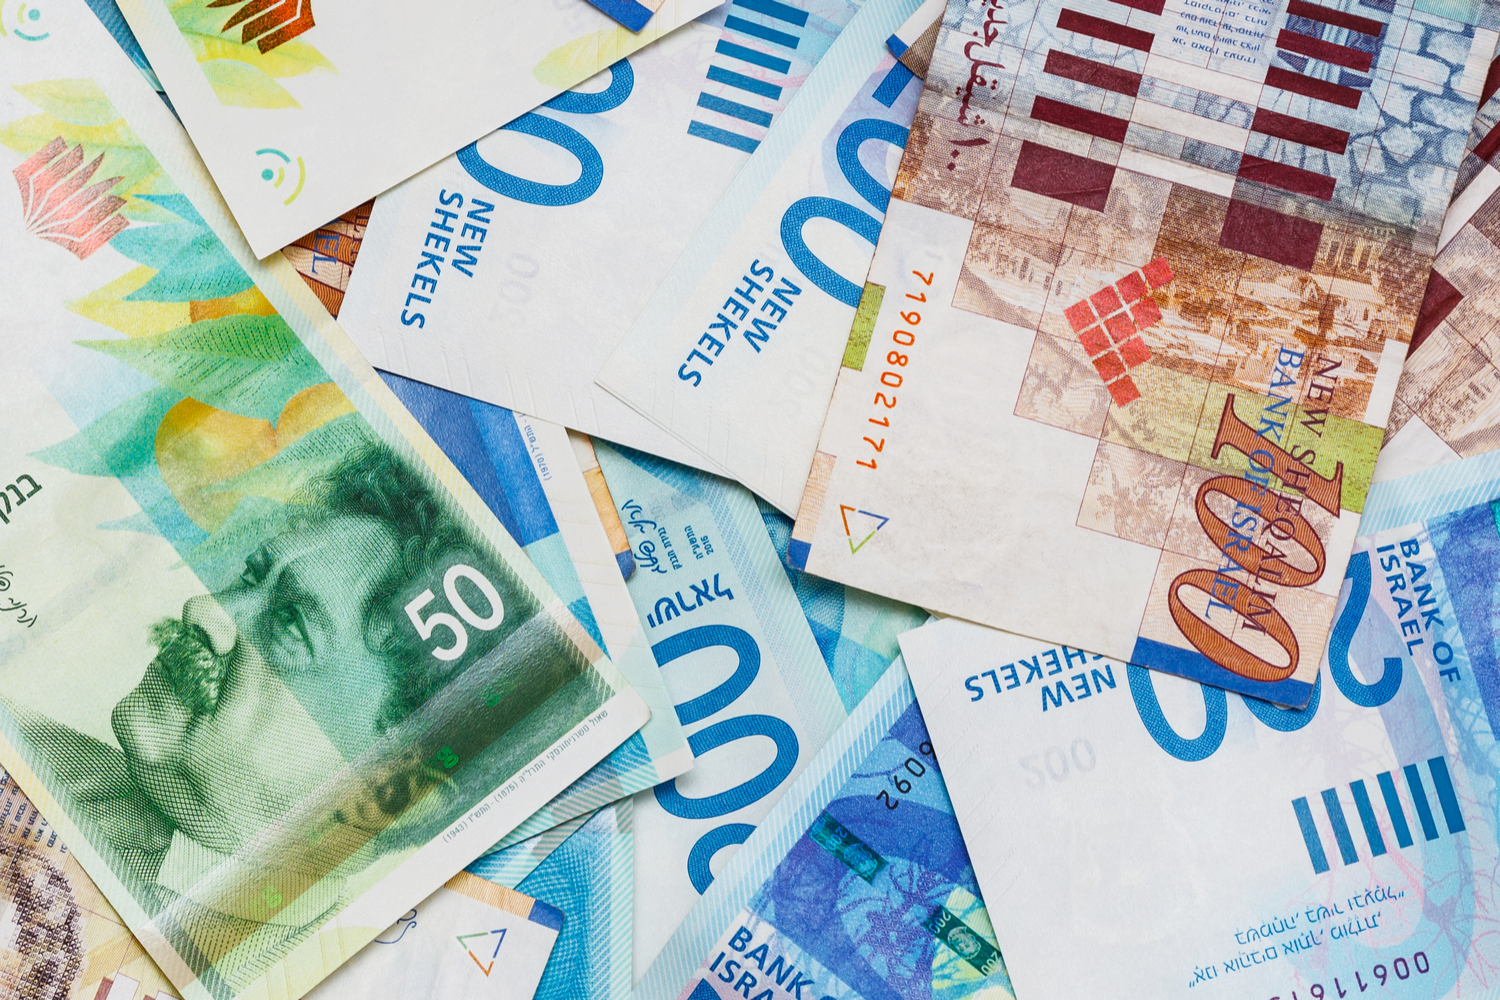
Stablecoins, cryptocurrencies whose price is meant to be pegged to a real-world asset such as a national currency or gold, are key pieces of plumbing for the crypto market, serving as a bridge between fiat money and digital assets. They are increasingly popular for non-crypto activities in emerging regions like Latin America and Southeast Asia, with uses ranging from saving in dollars, payments and cross-border transactions, a fresh report by venture capital firm Castle Island and hedge fund Brevan Howard Digital said.
Tether holds over $97 billion of U.S. Treasuries and repurchase agreements in its reserves as of second-quarter 2024, managed by New York-based global financial services firm Cantor Fitzgerald. Tether earns roughly $400 million a month in revenue from yields on those assets, Token Terminal estimated.
USDT users said they use the token due to its network effects, user trust, liquidity and its track record relative to other stablecoins, a survey in the report pointed out.
It’s also been helped by competitors’ woes.
USDC was hit by the failure of one of its reserve partners, Silicon Valley Bank, during the U.S. regional banking crisis of March 2023. While the token quickly regained its price peg, the event drove investors to rivals, mostly USDT. The token’s market cap has dwindled to $35 billion from $50 billion in two years.
BUSD, issued by U.S. fintech firm Paxos under the brand of crypto exchange giant Binance, was ordered to shut down by New York state regulators in early 2023. At the time, it was the third-largest stablecoin and boasted a market cap over $20 billion at its peak in late 2022.
New entrants have emerged recently, such as payments giant PayPal’s PYUSD token and decentralized alternatives from blockchain applications Aave and Curve, but has yet to challenge the leadership of centralized issuers Tether and Circle.
Edited by Sheldon Reback.
Disclosure
Please note that our
privacy policy,
terms of use,
cookies,
and
do not sell my personal information
has been updated
.
CoinDesk is an
award-winning
media outlet that covers the cryptocurrency industry. Its journalists abide by a
strict set of editorial policies.
In November 2023
, CoinDesk was acquired
by the Bullish group, owner of
Bullish,
a regulated, digital assets exchange. The Bullish group is majority-owned by
Block.one; both companies have
interests
in a variety of blockchain and digital asset businesses and significant holdings of digital assets, including bitcoin.
CoinDesk operates as an independent subsidiary with an editorial committee to protect journalistic independence. CoinDesk employees, including journalists, may receive options in the Bullish group as part of their compensation.
:format(jpg)/s3.amazonaws.com/arc-authors/coindesk/8b1395a8-12af-4705-9fe5-b862b248250d.png)