Still The Same Range, But Could Bitcoin Overcome $4000 Soon? – BTC Price Analysis Mar.10
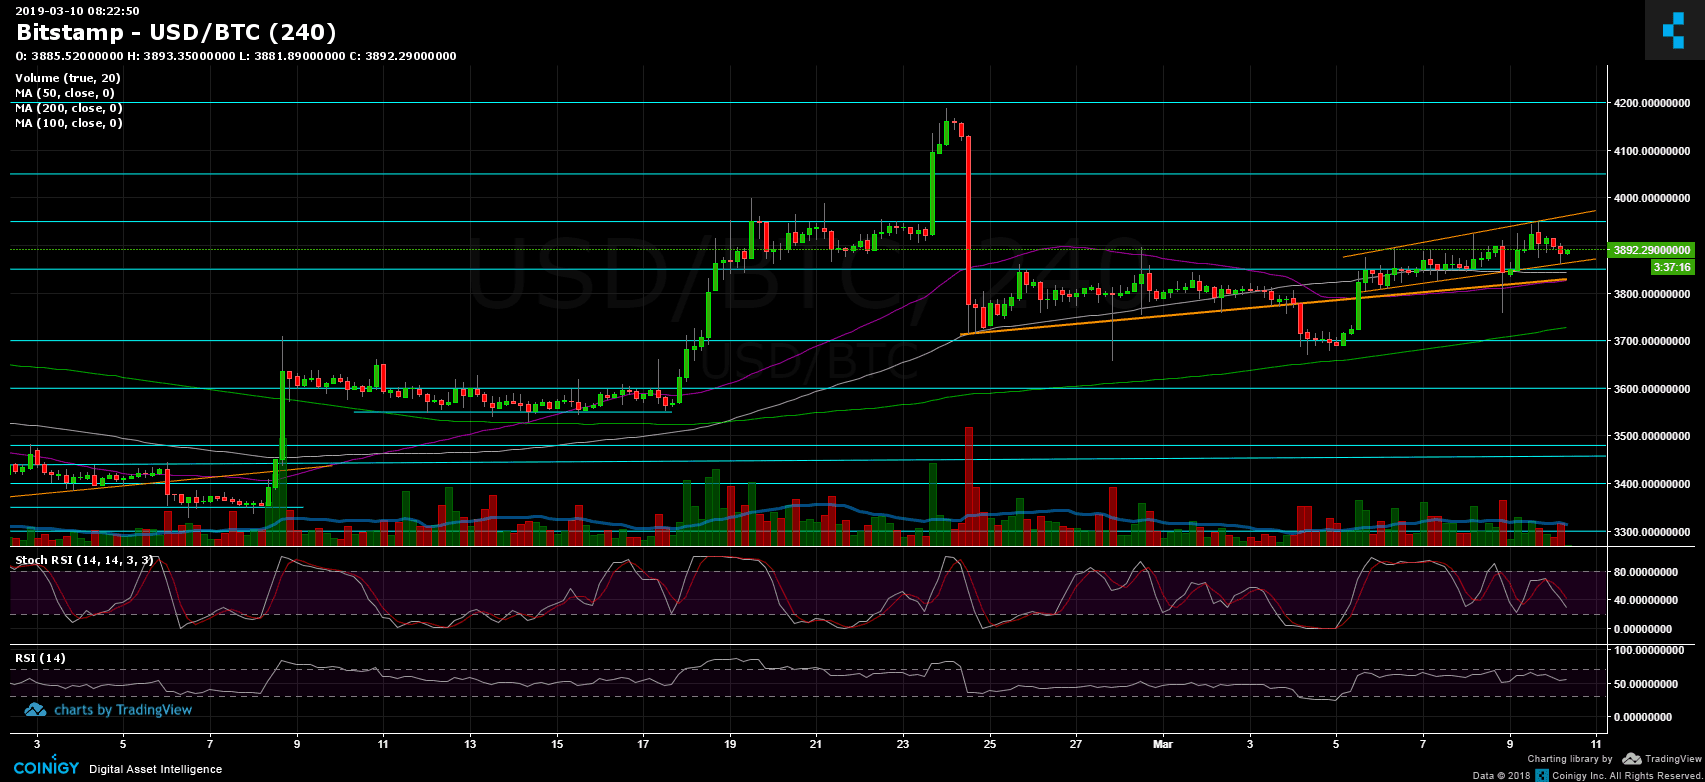
Following the 2-day price gap from six days ago, Bitcoin is back on top the mid-term ascending trend-line (marked in orange on the 4-hour chart). The good news is that Bitcoin had finally broken up the $3850 mark, and quickly reached the next mentioned target of $3950.
After completing the above, the coin had been rejected and turned around to re-test the $3850, as of now, to confirm the level as a support.
The bottom line is that Bitcoin is currently facing the $3950 – $4050 resistance area from above, and $3850 support from below.
Total Market Cap: $133.7 Billion
BTC Dominance: 51.7%
Looking at the 1-day & 4-hour charts
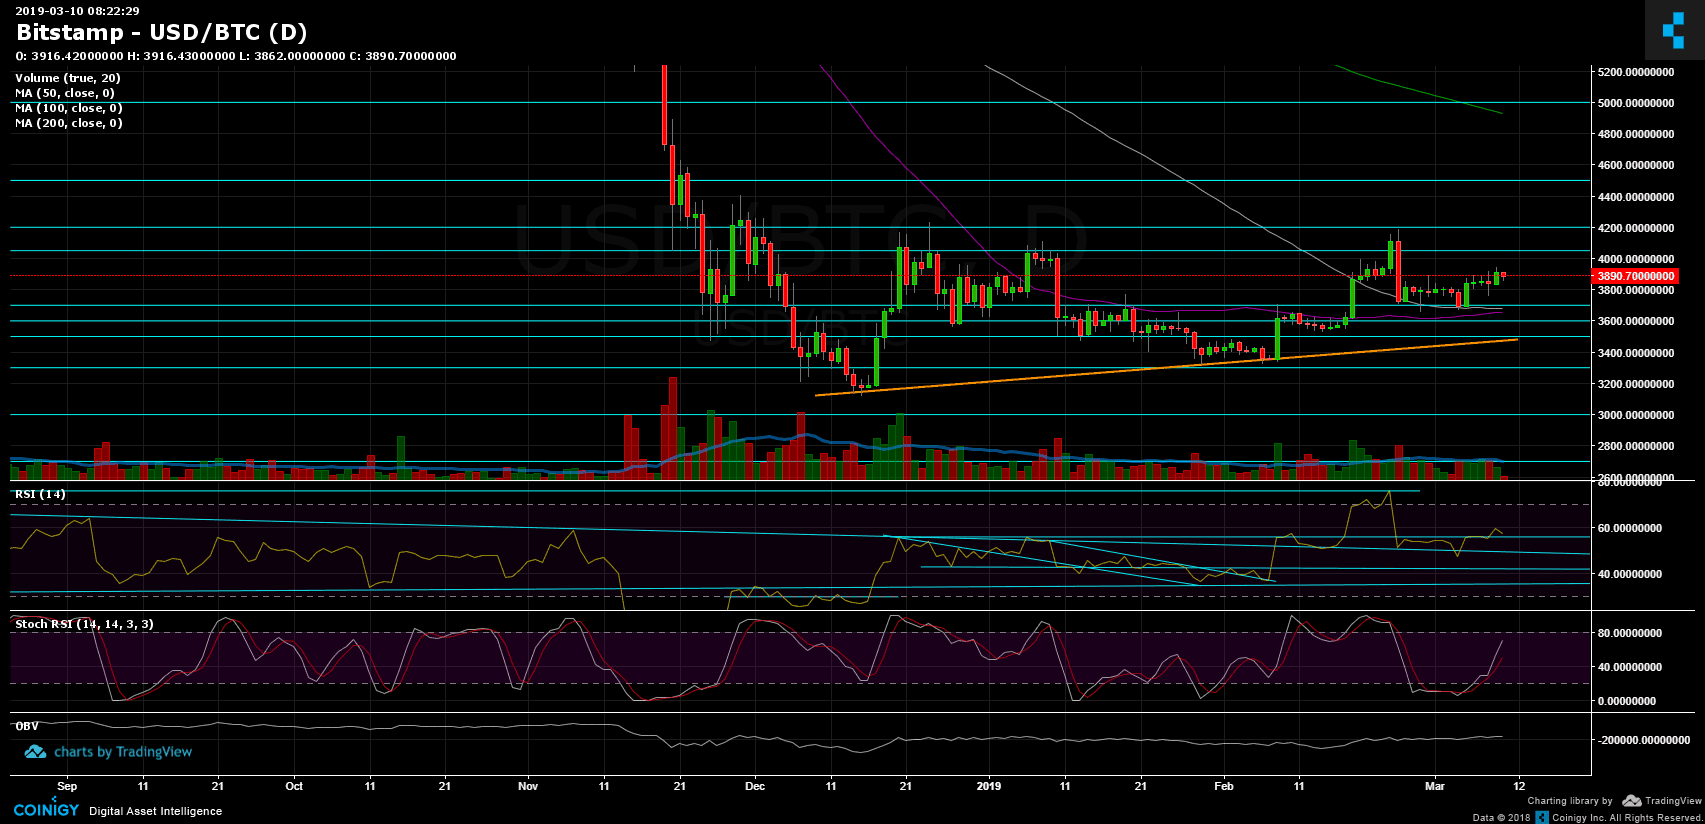
– Support/Resistance: Bitcoin is moving up, sticking to the mid-term ascending trend-line. From above: strong resistance lies at $3950 – $4050 area. Breaking up will likely send Bitcoin to face the significant resistance of $4200.
From below, the $3850 is now resistance turned support level. Breaking down and the next support level is the $3650 – $3700 zone along with the daily chart’s 50 and 100 moving average lines (marked in purple and white). Below lies the $3600 support level and the significant $3480 – $3500 support area.
– The daily chart’s RSI level: Following our previous BTC analysis, we can see that the RSI indicator recently overcame the critical 56 levels. As of now, it looks like the 56 RSI is being re-tested to confirm the level as support. So far, this is a healthy correction as long as it stays above 56 RSI.
– The daily trading volume: the volume is not significant over the past week. However, we do see more green candles popping up on the daily.
– BitFinex open short positions: Following a double retest of the 17K support line, and consolidation around the fragile area between a17K and 19K, finally the short positions have returned to ‘normal’: The current number is 20.8K open short positions.
BTC/USD BitStamp 4-Hour chart
BTC/USD BitStamp 1-Day chart
The post Still The Same Range, But Could Bitcoin Overcome $4000 Soon? – BTC Price Analysis Mar.10 appeared first on CryptoPotato.