Solana Price Analysis: SOL Stuck in a Range, Breakout Inbound?
Volatility is somewhat back in the market, but the question is if SOL can progress to the next key area.
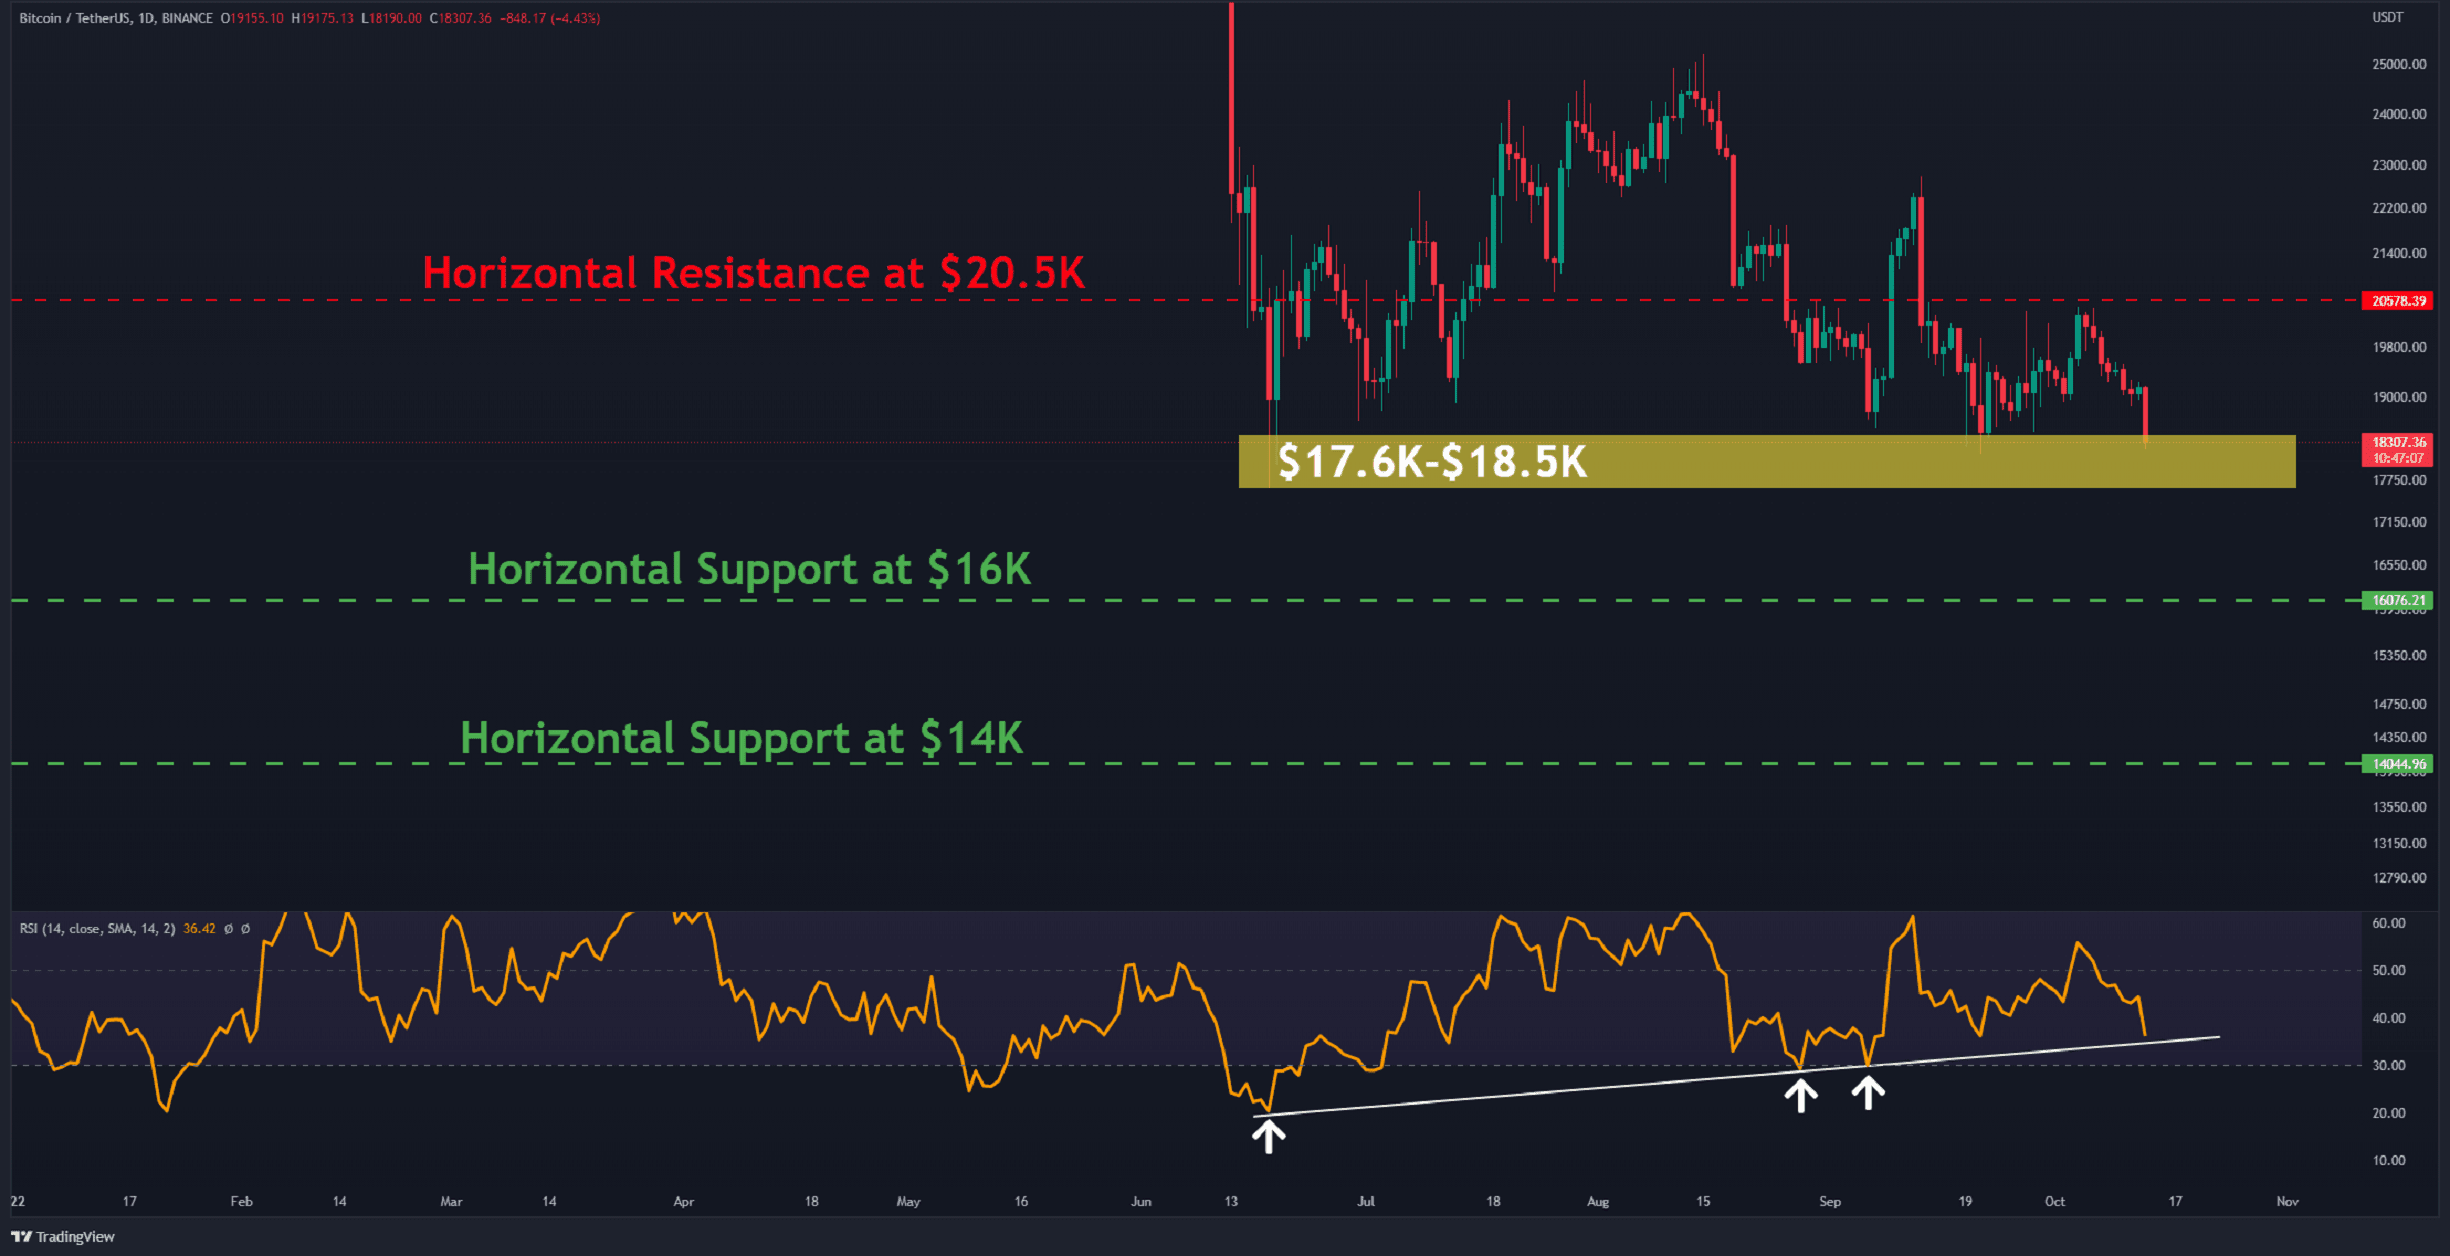
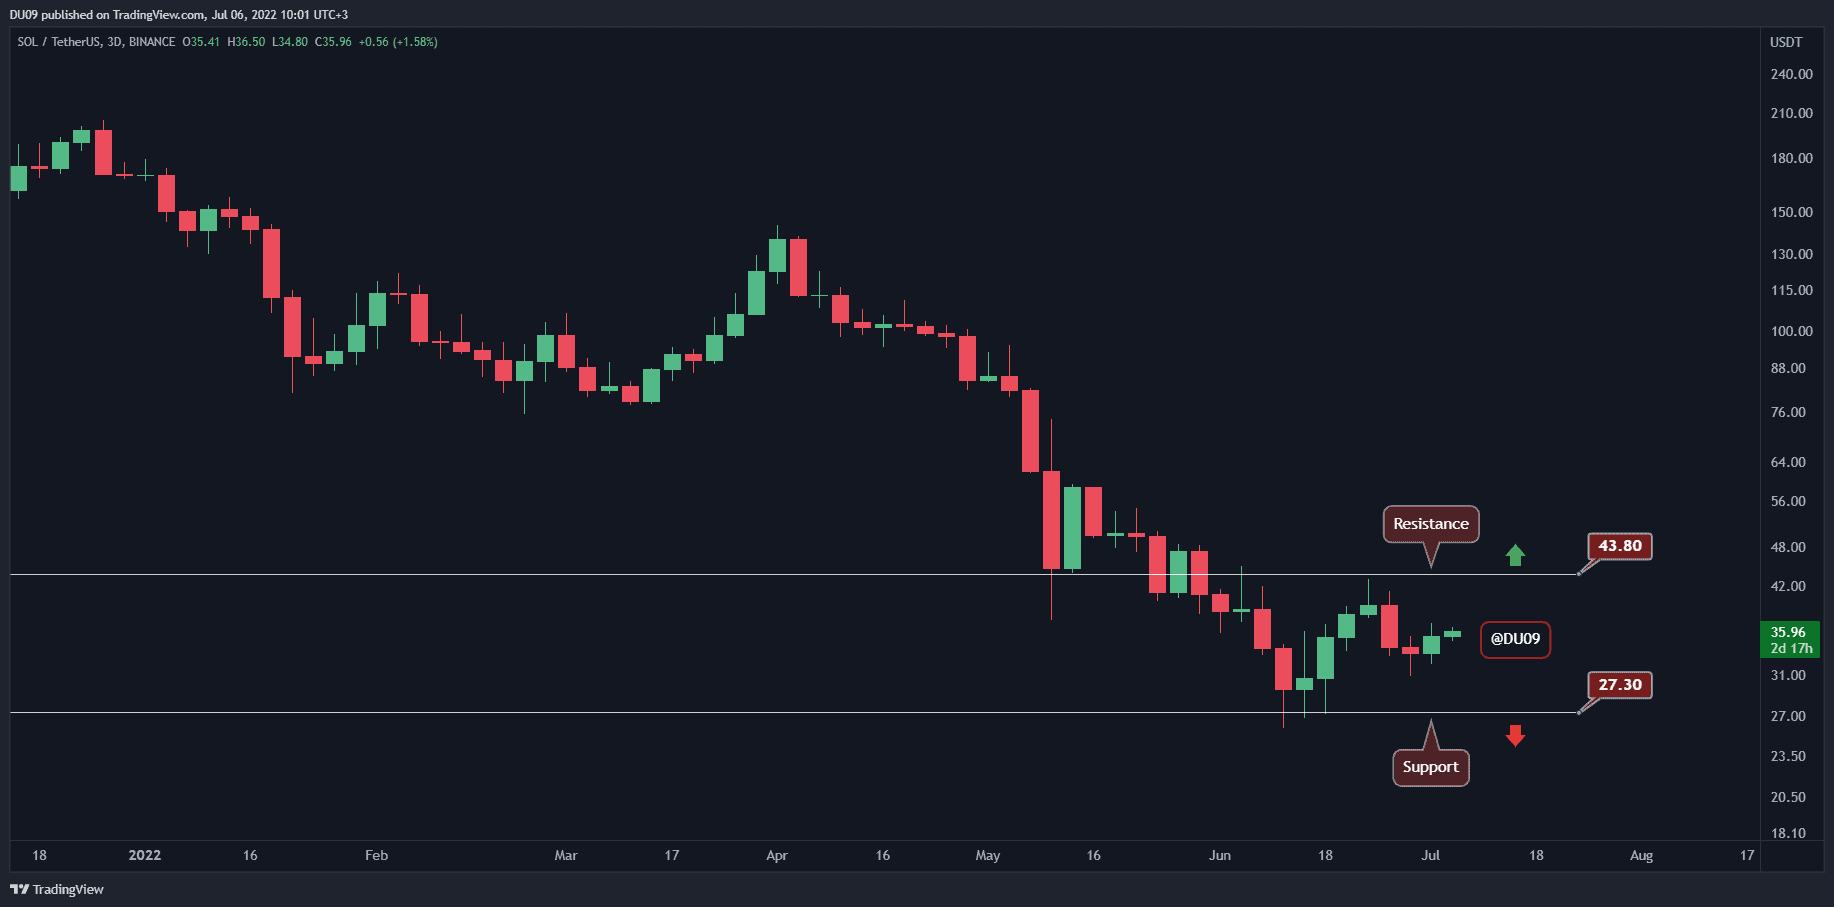
Key Support levels: $27
Key Resistance levels: $44
Solana is still stuck in a large price range and is unable to break away. With volatility increasing, the price may break out and enter into a clearer trend. The key support is found at $27 and the resistance at $44, while the price is right in the middle of this range at the time of this post.
Technical Indicators
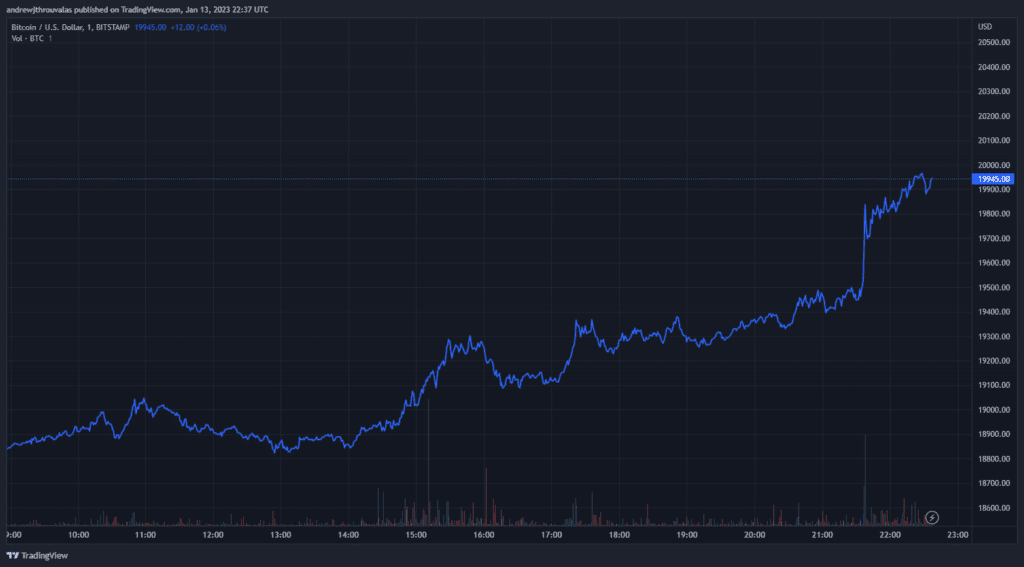
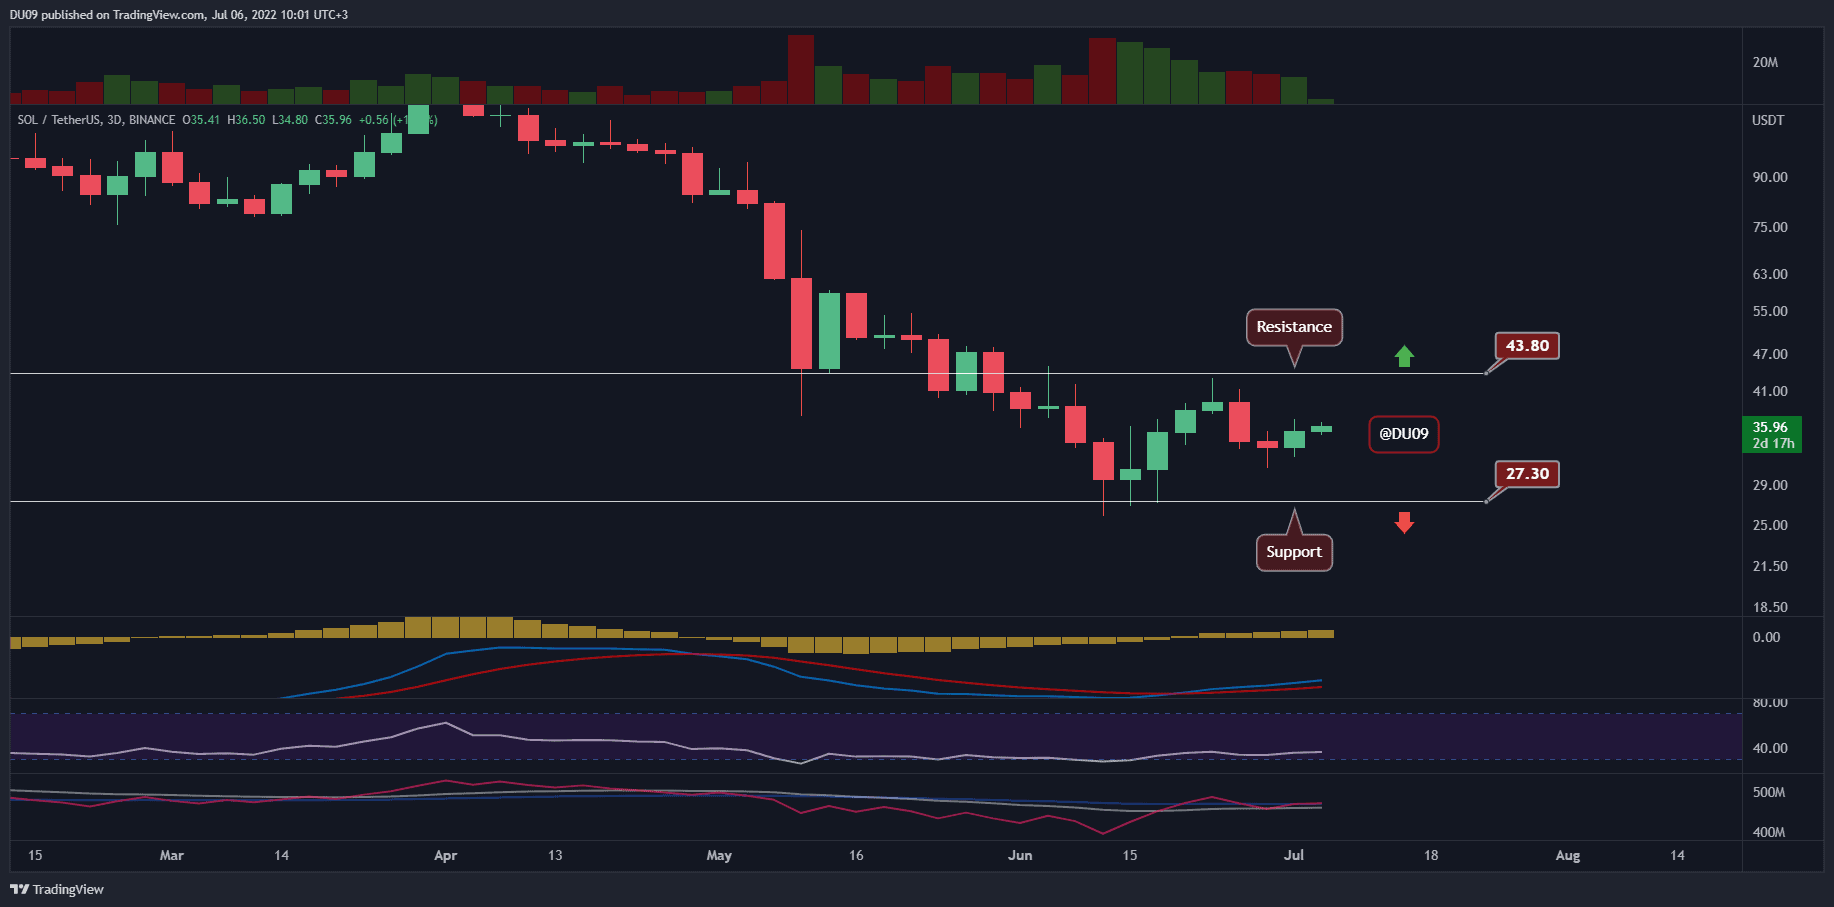
Trading Volume: The volume increased at the start of this week. This led to significant volatility but not enough to take SOL to the key levels in this range.
RSI: The daily RSI remains under 50 points, and buyers will have to show more strength if they want to push the price higher.
MACD: The daily MACD is on the bullish side, but there is no momentum as the price is stuck in a flat trend. Until this changes, SOL will likely continue to move sideways.
Bias
The short-term bias for SOL is neutral.
Short-Term Prediction for SOL Price
The current volatility may bring more attention to Solana, and this could push the price to one of the key levels of this range. The bias is neutral at this time, thus, no clear trend can be identified. A break away from this channel will change this bias.