Solana Price Analysis: SOL Holds Above Critical Support, is Reversal in Play?
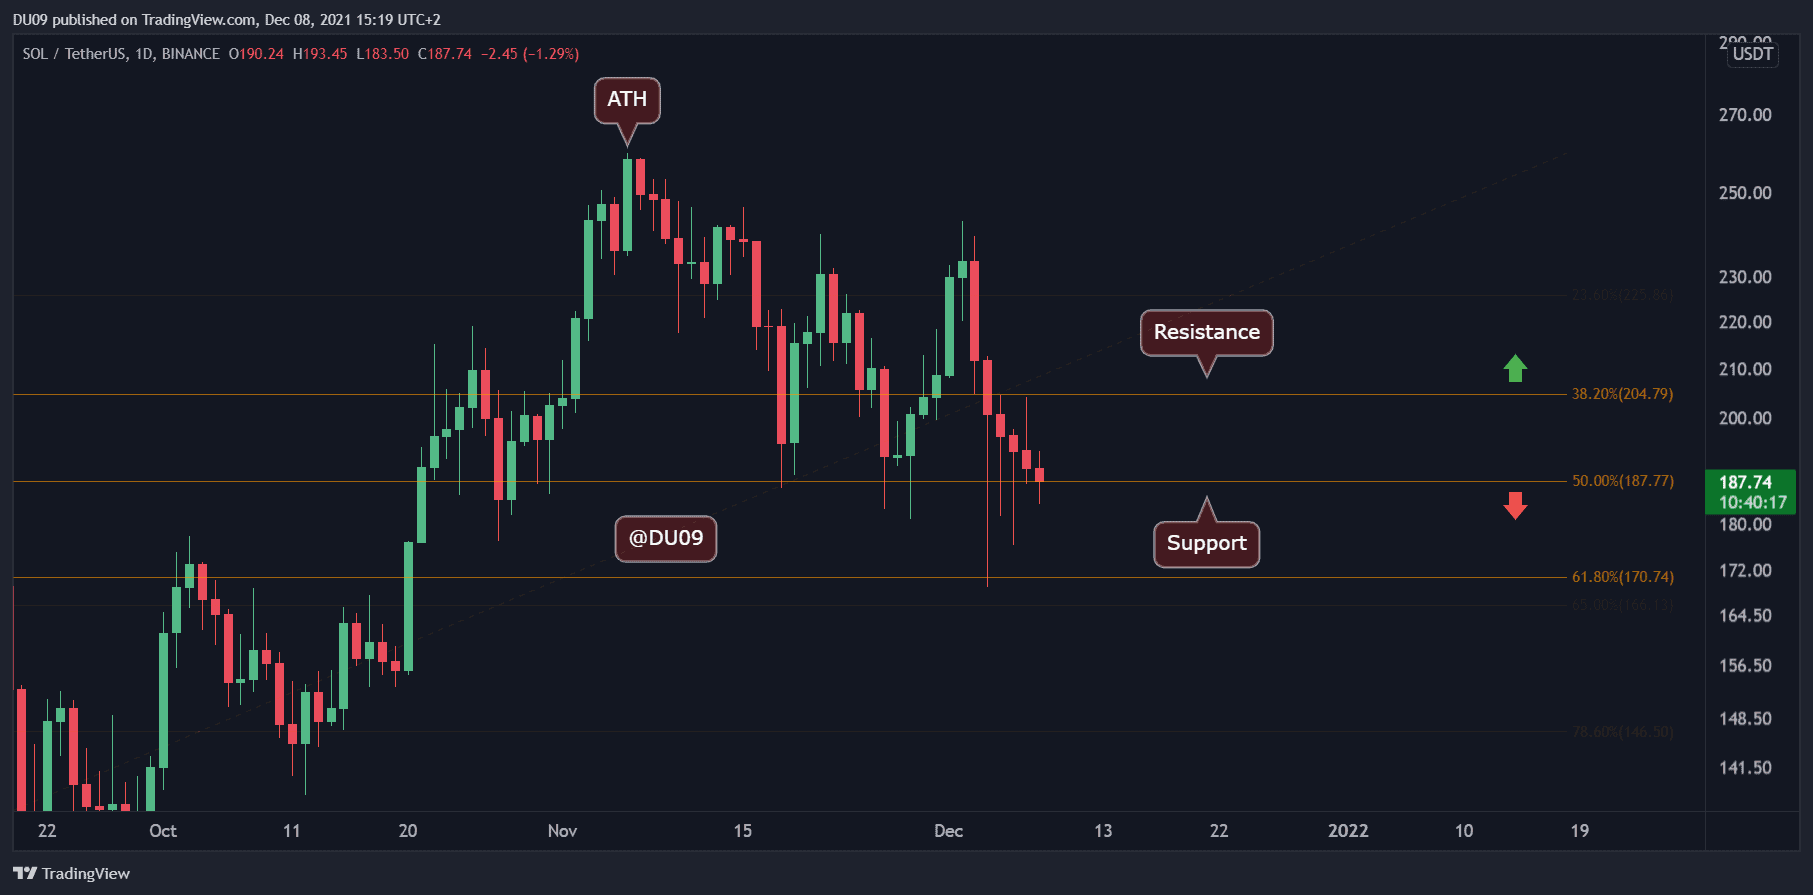
Key Support levels: $187, $170
Key Resistance level: $204
SOL managed to find good support on the $187 level, which may provide some hope when it comes to halting the downtrend. The current resistance sits at $204, and it may take longer for SOL to attempt to breach above it.
Ever since the cryptocurrency made the all-time high at $260, the price has charted lower lows and lower highs, putting SOL in a clear downtrend. Until this is reversed, the bears remain in control.
Technical Indicators
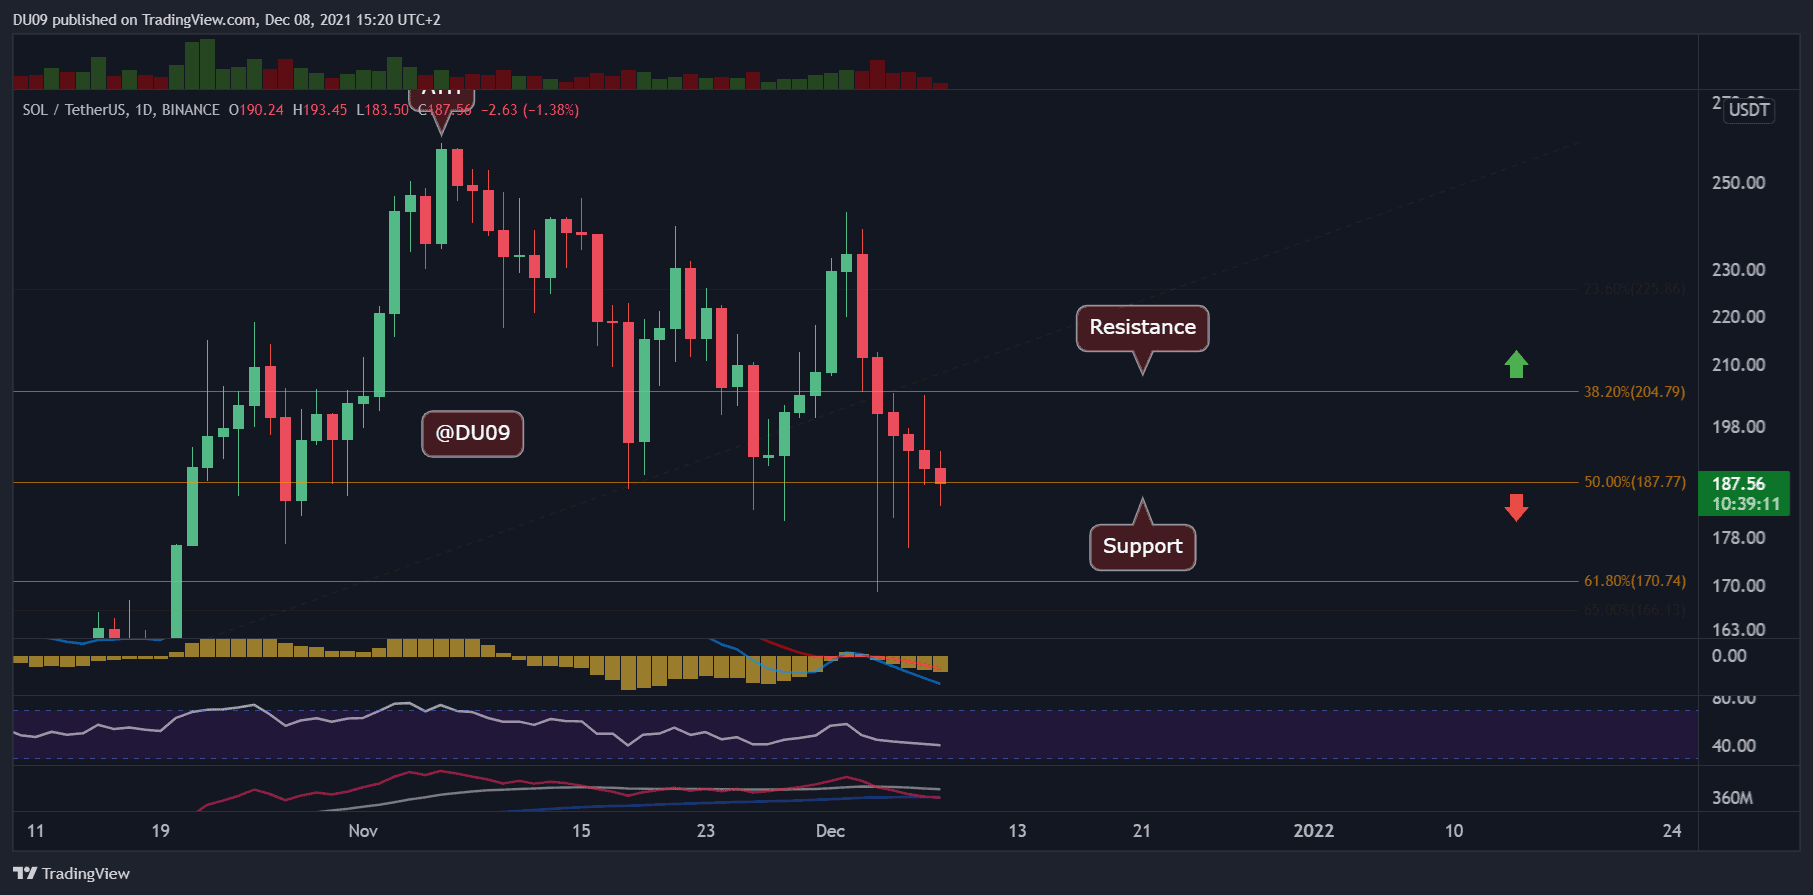
Trading Volume: The volume peaked during the December 4th crash, and since then it has been decreasing every day as the price fell. This is a good sign for bulls as they may have an opening to take back control from bears.
RSI: The daily RSI continues to go lower. If bulls manage to stop the downtrend at the current support level, then the RSI can finally attempt a reversal. On the 4-hour timeframe, the RSI is making higher lows which gives hope to bulls.
MACD: MACD remains bearish on the daily timeframe. The moving averages are expanding, and the histogram is making lower lows. This is a bearish signal, and a reversal seems far away at this time.
Bias
The bias is bearish as long as Solana fails to stop the downtrend.
Short-Term Prediction for SOL Price
Solana had a very poor month in November and a worse start in December with the crash. The price action is in a clear downtrend, and so far, all attempts to stop it failed. If SOL can hold above the key support at $187, then it might enter a consolidation which would flip the bias to neutral.