Solana Leapfrogs XRP as Fifth-Largest Crypto, Spurred by Meme Coin Mania
/arc-photo-coindesk/arc2-prod/public/LXF2COBSKBCNHNRE3WTK2BZ7GE.png)
Solana (SOL) has overtaken XRP as the fifth-largest cryptocurrency, with its market cap hitting a 20-month high of $33.7 billion, according to CoinMarketCap.
This week, total value locked (TVL) on Solana topped $1 billion for the first since FTX’s collapse in November last year, spurred by rising asset prices and consistent inflows to DeFi protocols.
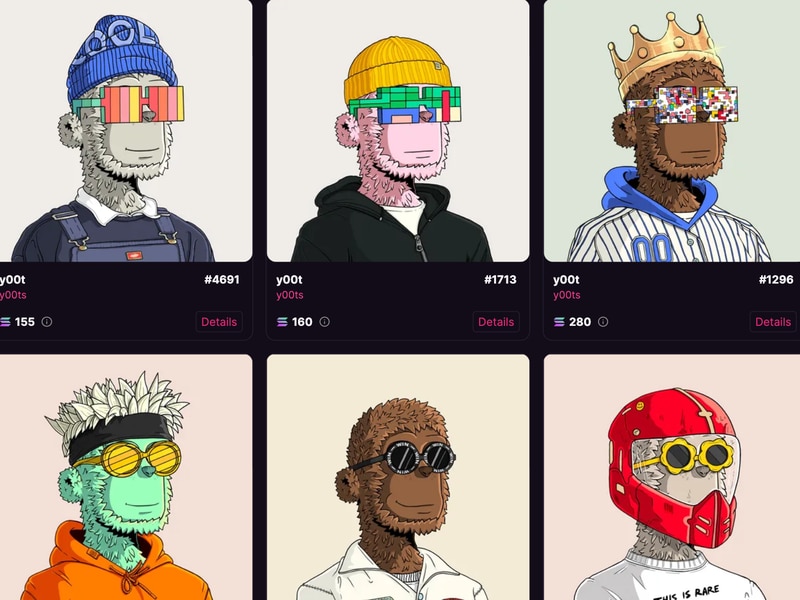
Decentralized exchanges on Solana have experienced a boost in trading volume. On Dec. 15, Orca facilitated $746 million in volume, it has previously surpassed $100 million only once before November. Much of the increased activity can be attributed to meme coins like Bonk, a dog-themed token that now has a market cap of more than $1.2 billion.
As speculators race to find the next meme coin that turns hundreds of dollars into hundreds of thousands of dollars, traders typically purchase Solana as the underlying asset before converting that into their meme coin of choice. And every time they sell the meme coin back into Solana they effectively prompt a wave of buying pressure.
But much of the recent focus has been on Solana itself. The blockchain appears to improved network stability following a series of outages last year. It has also distanced itself from FTX following the collapse of the exchange, which purchased $1 billion worth of Solana-based tokens before it filed for bankruptcy.
SOL is currently trading at $81.04 having risen by 9.14% over the past 24 hours. Trading volume is up by 39% to $2.6 billion, according to CoinMarketCap.
Edited by Sheldon Reback.


