Solana is Up 6% Daily, Here’s the Key Resistance (SOL Price Analysis)
Solana continues to perform despite a decline in the buying volume, booking a 6% increase in the past 24h.
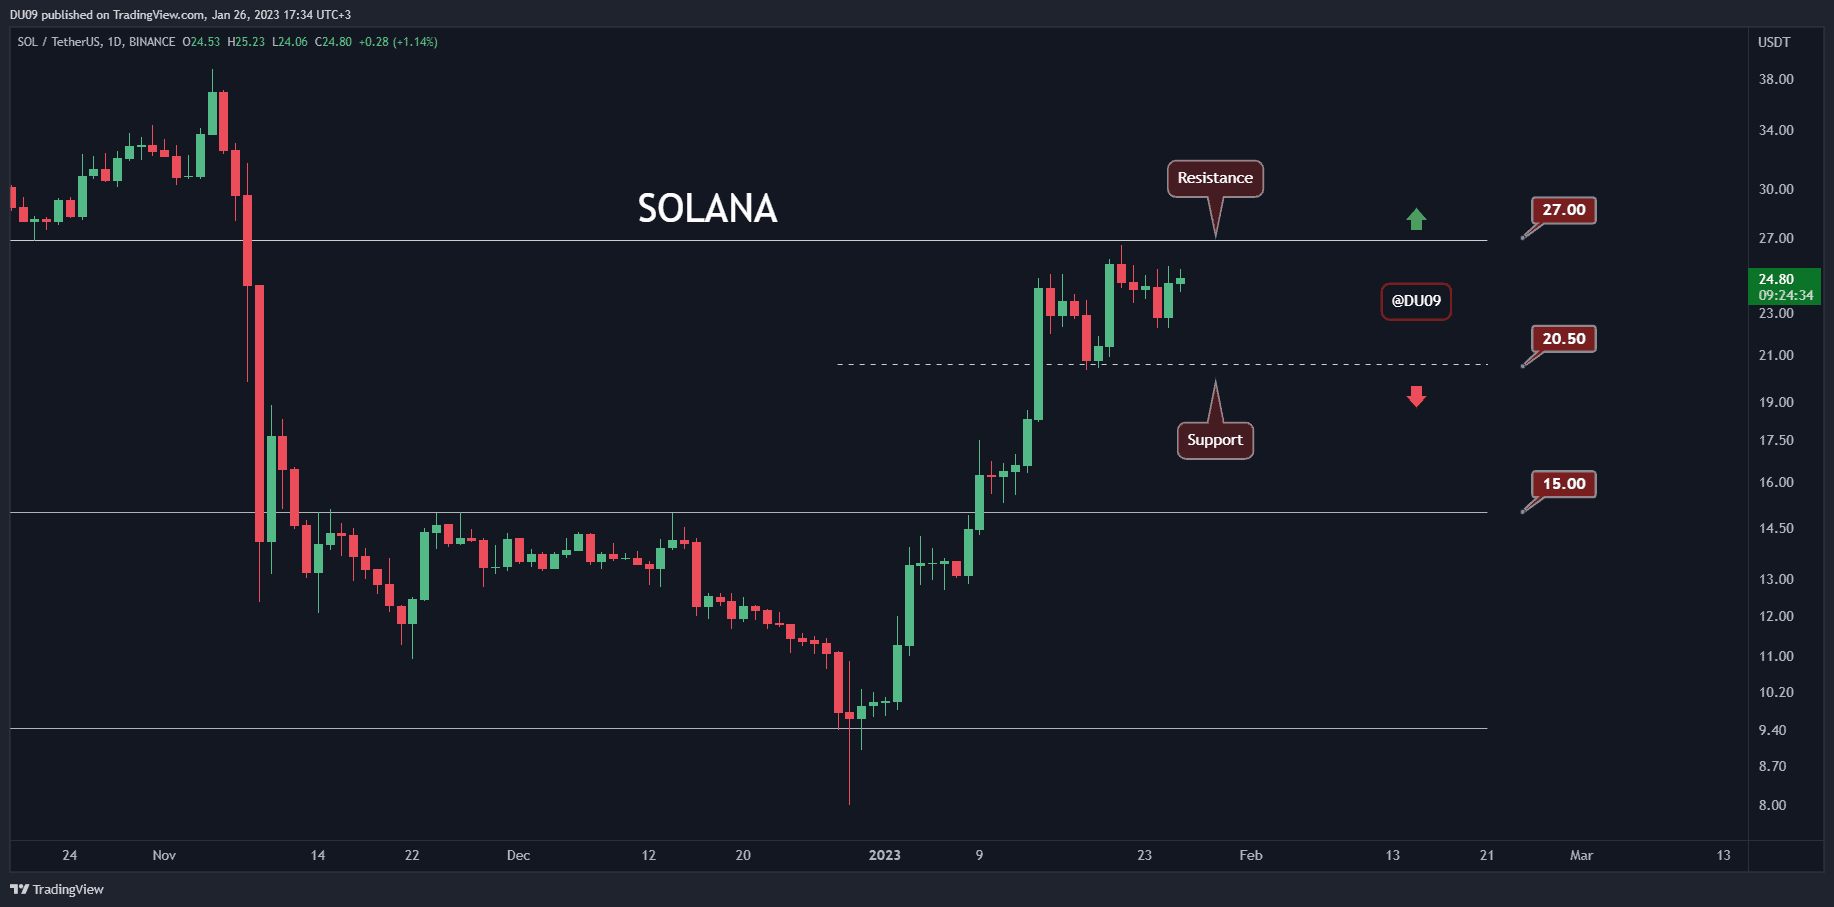
Key Support levels: $20
Key Resistance levels: $27
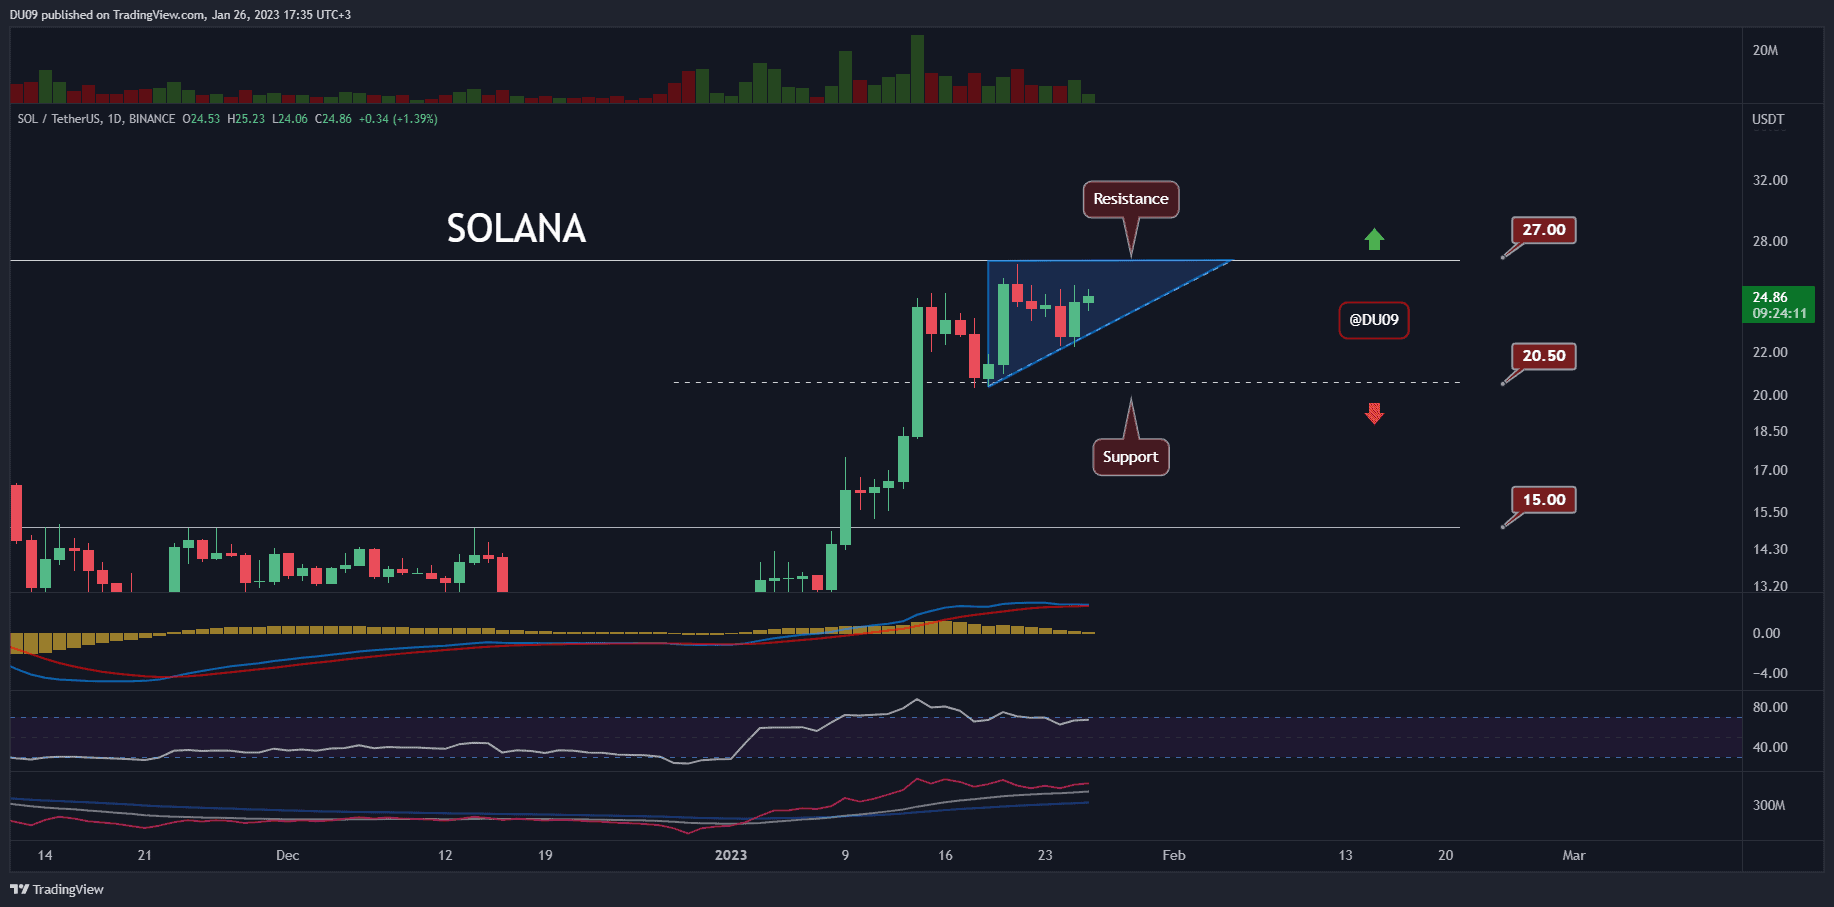
The resistance at $27 is keeping bulls in check. They have been rejected at that level on Saturday. In the process, SOL has formed an ascending triangle, and a major breakout is expected over the coming days. Should bulls fail, then the price can quickly fall to the $20 support.
Trading Volume: The considerable buying volume has allowed Solana to remain on the offensive, but the momentum is fading.
RSI: The daily RSI is just under 80 points and is making lower highs. This is bearish.
MACD: The daily MACD is still bullish but may do a bearish cross at any moment based on the histogram, which is also making lower highs.
Bias
The bias for SOL is neutral at this time.
Short-Term Prediction for SOL Price
There are some clear signs that Solana may not be able to overtake the key resistance at $27. Buyers would really need to step up to achieve that, and the current volume and indicators don’t show it.
The post Solana is Up 6% Daily, Here’s the Key Resistance (SOL Price Analysis) appeared first on CryptoPotato.