Solana Fails at $60 as Bears Prevent Any Further Upside (SOL Price Analysis)
Solana had a good attempt at breaking above $60, but the market momentum was against it.
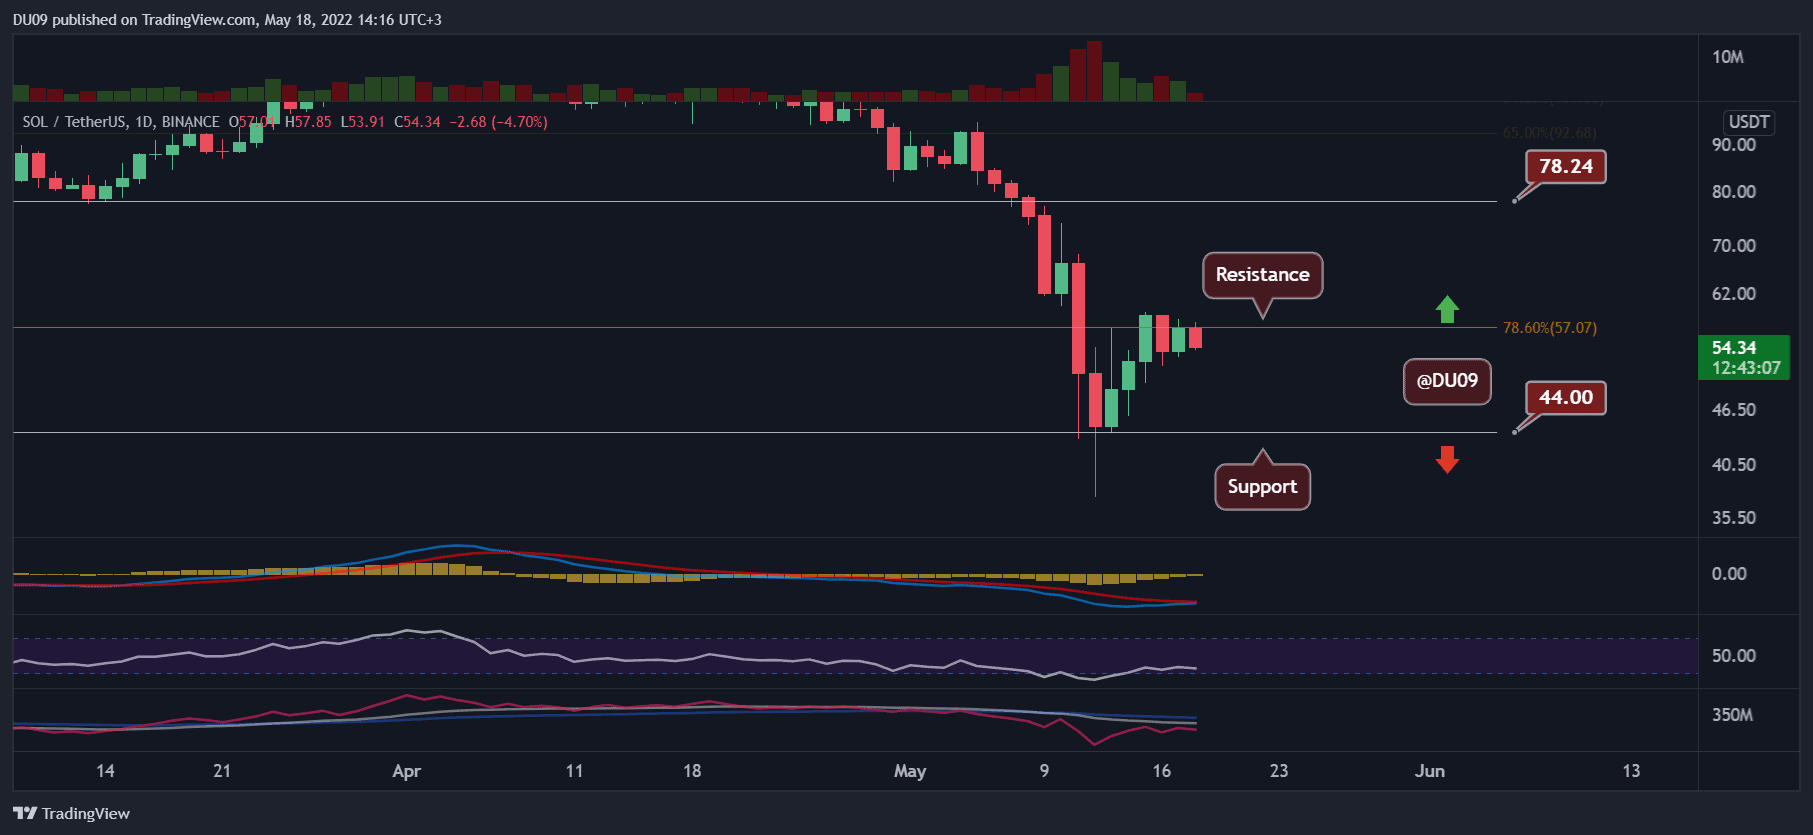
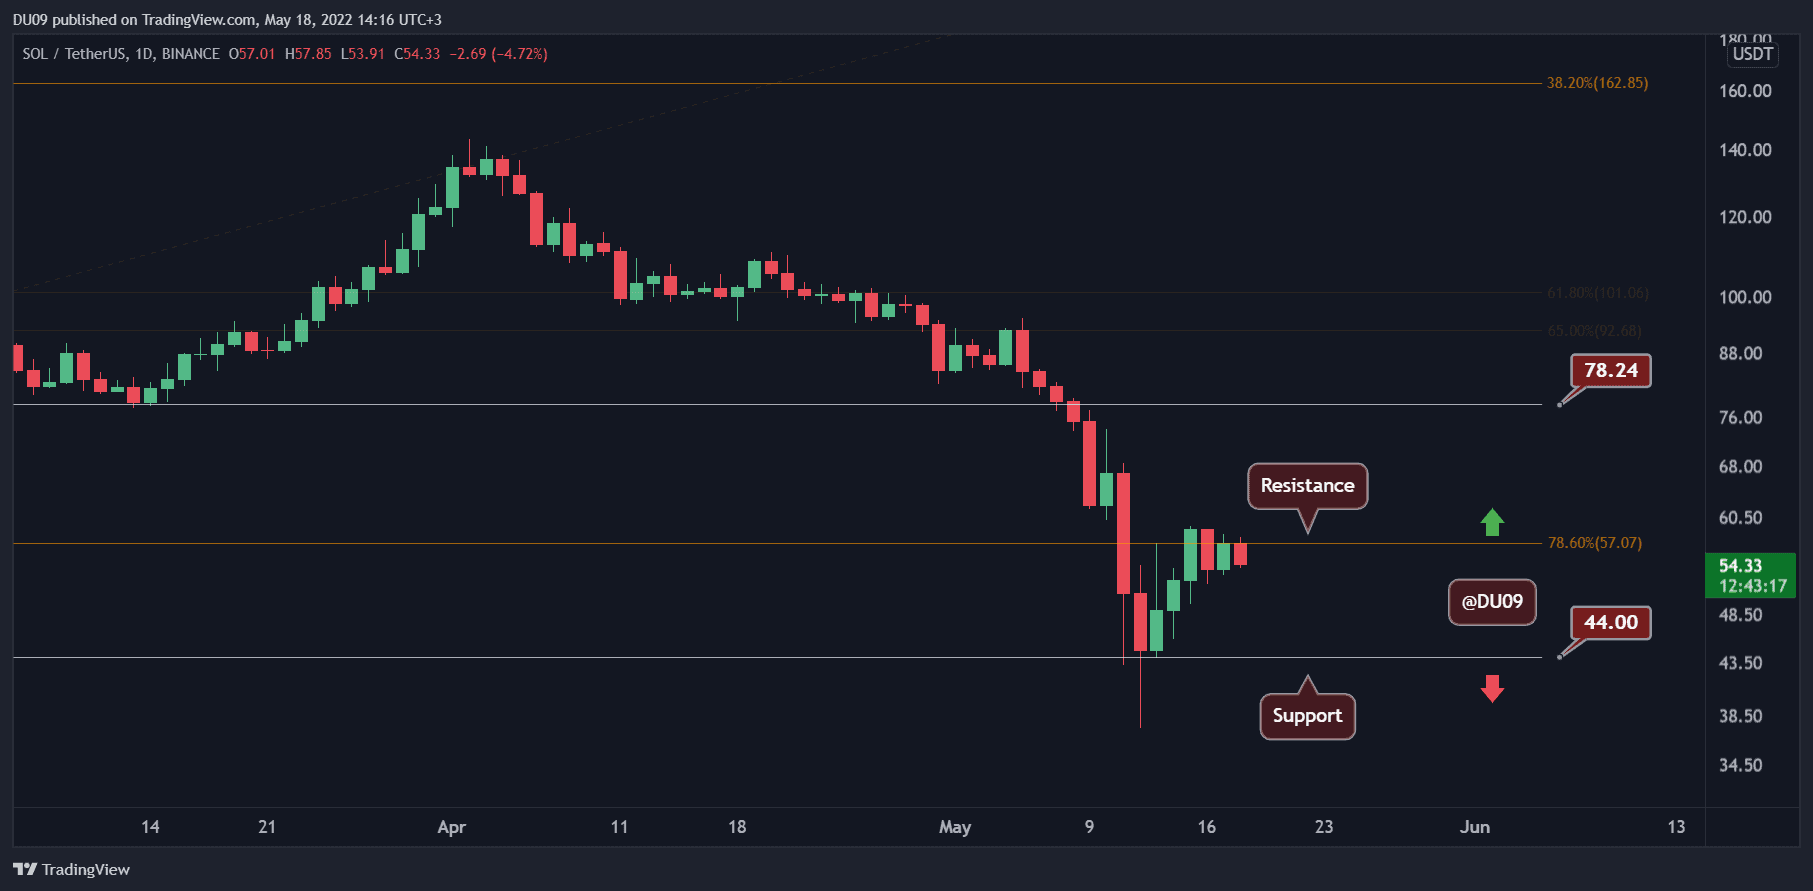
Key Support levels: $44
Key Resistance levels: $57, $78
Solana attempted to rally after reaching the support at $44 and gained over 50%, reaching the key resistance at $57. However, at that point, sellers intervened and prevented any further upside momentum, pushing the price back to the lower $50s. If buyers cannot recover from this soon, SOL could end back on the key support.
Technical Indicators
Trading Volume: Similar to most of the market, SOL’s volume remains low after spiking during the crash on May 12th.
RSI: The daily RSI managed to leave the oversold area at 30 points but now struggles to continue upwards. A failure here could send the RSI back under 30 points.
MACD: The daily MACD remains bearish while the histogram is making higher lows. Buyers really need to step up as otherwise, they will lose control of the price again.
Bias
The bias for SOL is neutral. The cryptocurrency appears to be stuck in a range between $44 and $57.
Short-Term Prediction for SOL Price
While Solana’s price is found in a range, this is unlikely to last since market forces seem more likely to push it out of this area one way or another. Unless buyers come back, SOL might retest the $44 support level based on the current indicators.